6

I have styled a polygon shapefile with hexadecimal colours from a field (it's a geology layer and the colours are those used by the BC provincial gov't). The layer looks great, but the data-defined colours don't appear in the legend. How do I get the legend to use the data-override colours?

Here is the link to the data I'm using: BC geology shapefiles

(EDIT 2019-03-15: BC gov't data catalogue is currently down; download the geological data from: Google Drive (22MB) )

What I have managed so far:

  • Import the hex colour CSV and perform a table join to get the correct colours lined up with the appropriate stratigraphic units. No problem.
  • Colour the polygons with those layers. My method:

  • Open Item Properties: Layer Styling.

  • Select "Categorized" style, and select "strat_name" for column. Click "classify"/"apply". The strat is now assigned random colours.
  • Next to "Symbol" click "Change...". -under "Fill" highlight "Simple fill" -Set data-defined override for fill (and stroke) to my "color_hex" column using "Field type:string".
  • Click "apply" again. Now I have the colours I want on the layer.

The map looks the way it's supposed to, but the legend still has the randomly assigned colours from the original "categorized" or "single style" colour ramp application.

EDIT (2019-03-15): Incorporating aspects of Andy Harfoot's and User136827's answer has moved things closer to success. A little bit more help is needed, though...

The new process so far: 1) Prepare a "dummy" .gpl file following User136827's method. 2) From the BC geology dataset open the bc_strat_unit_colour_rgb.csv file in a spreadsheet program, and sort by the strat_unit field. 3) Copy-paste the data (no headers) from both columns into the .gpl file. 4) In QGIS classify the geology shapefile by field "strat_unit" and colour it using the .gpl file for the colour ramp.

This colours the map correctly, but the value that will display in the legend are from the strat_unit field and look like this: "CmA", "EJHCsy", etc., instead of "Atlin Group" or "Kamloops Group" or the actually useful name from another column.

What I think could solve it: 1) Save the style (.qml) from the newly styled shapefile. 2) Open the style file in whatever text editor (following Andy Harfoot's method).

It looks like this (heavily truncated; there are 2150 categories:

<!DOCTYPE qgis PUBLIC 'http://mrcc.com/qgis.dtd' 'SYSTEM'>
<qgis styleCategories="AllStyleCategories" hasScaleBasedVisibilityFlag="0" maxScale="0" simplifyDrawingHints="1" simplifyLocal="1" simplifyAlgorithm="0" labelsEnabled="0" minScale="1e+8" version="3.6.0-Noosa" simplifyMaxScale="1" readOnly="0" simplifyDrawingTol="1">
  <flags>
    <Identifiable>1</Identifiable>
    <Removable>1</Removable>
    <Searchable>1</Searchable>
  </flags>
  <renderer-v2 attr="strat_unit" type="categorizedSymbol" enableorderby="0" symbollevels="0" forceraster="0">
    <categories>
      <category label="" render="true" value="" symbol="0"/>
      <category label="?dr" render="true" value="?dr" symbol="1"/>
    </categories>
    <symbols>
      <symbol clip_to_extent="1" type="fill" force_rhr="0" name="0" alpha="1">
        <layer class="SimpleFill" pass="0" enabled="1" locked="0">
          <prop k="border_width_map_unit_scale" v="3x:0,0,0,0,0,0"/>
          <prop k="color" v="77,180,126,255"/>
          <prop k="joinstyle" v="bevel"/>
          <prop k="offset" v="0,0"/>
          <prop k="offset_map_unit_scale" v="3x:0,0,0,0,0,0"/>
          <prop k="offset_unit" v="MM"/>
          <prop k="outline_color" v="0,0,0,0"/>
          <prop k="outline_style" v="solid"/>
          <prop k="outline_width" v="0.26"/>
          <prop k="outline_width_unit" v="MM"/>
          <prop k="style" v="solid"/>
          <data_defined_properties>
            <Option type="Map">
              <Option type="QString" value="" name="name"/>
              <Option type="Map" name="properties">
                <Option type="Map" name="fillColor">
                  <Option type="bool" value="false" name="active"/>
                  <Option type="QString" value="&quot;rgb_col&quot;" name="expression"/>
                  <Option type="int" value="3" name="type"/>
                </Option>
              </Option>
              <Option type="QString" value="collection" name="type"/>
            </Option>
          </data_defined_properties>
        </layer>
      </symbol>
      <symbol clip_to_extent="1" type="fill" force_rhr="0" name="1" alpha="1">
        <layer class="SimpleFill" pass="0" enabled="1" locked="0">
          <prop k="border_width_map_unit_scale" v="3x:0,0,0,0,0,0"/>
          <prop k="color" v="255,222,237,255"/>
          <prop k="joinstyle" v="bevel"/>
          <prop k="offset" v="0,0"/>
          <prop k="offset_map_unit_scale" v="3x:0,0,0,0,0,0"/>
          <prop k="offset_unit" v="MM"/>
          <prop k="outline_color" v="0,0,0,0"/>
          <prop k="outline_style" v="solid"/>
          <prop k="outline_width" v="0.26"/>
          <prop k="outline_width_unit" v="MM"/>
          <prop k="style" v="solid"/>
          <data_defined_properties>
            <Option type="Map">
              <Option type="QString" value="" name="name"/>
              <Option type="Map" name="properties">
                <Option type="Map" name="fillColor">
                  <Option type="bool" value="false" name="active"/>
                  <Option type="QString" value="&quot;rgb_col&quot;" name="expression"/>
                  <Option type="int" value="3" name="type"/>
                </Option>
              </Option>
              <Option type="QString" value="collection" name="type"/>
            </Option>
          </data_defined_properties>
        </layer>
      </symbol>
    <colorramp type="preset" name="[source]">
      <prop k="preset_color_0" v="255,222,237,255"/>
      <prop k="preset_color_1" v="255,222,237,255"/>

Following Andy Harwood's answer, by editing category label="?dr" to something like category label="Cache Creek Group" I get the legend values I'm looking for. However, I'd like to avoid doing that for 2150 entries.

the final question (I hope): How might one programmetrically replace label="value1" with label="value2" in a .qml file using a lookup table instead of individually find-replacing or copy-pasting?

Alternatively, if in QGIS I could set a different column as the values for the legend labels I think that would work too (and be easiest).

(I know it probably will not be in QGIS, but I think this is still a QGIS question.)

1
  • Thanks for updating the link to the data. Having had a look at it, I can see that there will be some problems if you want to categorize by stratigraphic name as there are 84 names (strat_name) that are associated with two or more different RGB values, so you may have to think of an alternative approach. Commented Mar 18, 2019 at 10:09

3 Answers 3

3

The legend doesn't reflect data-defined symbology - it only ever shows the "base" symbology as it were, i.e. the individual symbols for each data source which you see in the layers panel.

Since your strat_name matches up to a color_hex value, you may wish to categorise by the color_hex column (to generate the correctly coloured symbology that will appear in the legend), then manually change the labels to reflect the appropriate strat_name column.

You can then save that style so you don't need to keep recreating it every single time.

2
  • Thanks! Unfortunately there are >2000 entries to hand-edit. So I'd like to avoid that if possible.
    – Nick_W
    Commented Mar 16, 2019 at 1:53
  • It sounds like a PyQGIS script would be the smartest approach - programmatically update symbology colour based on strat_name value - but unfortunately I'm no help there as I've only just started learning it myself. :(
    – she_weeds
    Commented Mar 16, 2019 at 3:47
3

Given that you have the colours and associated stratigraphic unit name, you should be able to take a solid filled style from the QGIS style library (through the Style Manager), export it and then use the resulting XML to script a set of styles, one for each of the BC geological units. These can then be associated (by matching on the unit name) to categories in your data.

The link to the data that you provided appears broken, so I've mocked something up below:

Here is my sample style in the QGIS style manager XML interchange format:

<!DOCTYPE qgis_style>
<qgis_style version="1">
  <symbols>
    <symbol name="Limestone" clip_to_extent="1" force_rhr="0" alpha="1" type="fill" tags="BC Geology">
      <layer locked="0" pass="0" class="SimpleFill" enabled="1">
        <prop v="3x:0,0,0,0,0,0" k="border_width_map_unit_scale"/>
        <prop v="175,240,242,255" k="color"/>
        <prop v="bevel" k="joinstyle"/>
        <prop v="0,0" k="offset"/>
        <prop v="3x:0,0,0,0,0,0" k="offset_map_unit_scale"/>
        <prop v="MM" k="offset_unit"/>
        <prop v="0,0,0,255" k="outline_color"/>
        <prop v="solid" k="outline_style"/>
        <prop v="0.26" k="outline_width"/>
        <prop v="MM" k="outline_width_unit"/>
        <prop v="solid" k="style"/>
      </layer>
    </symbol>
  </symbols>
</qgis_style>

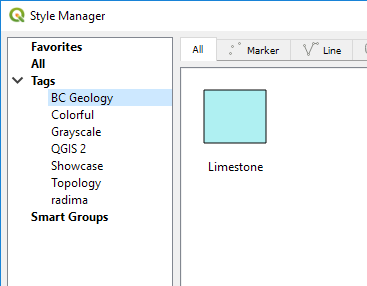
This imports in the style manager as follows:

Style import

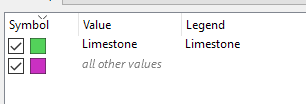
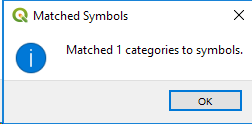
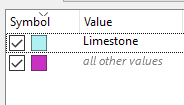
If I then mock up a categorised symbology with 'Limestone' as one of the categories, once classified, I can choose the Advanced > Match to Saved Symbols to associate each category with a style from the library, matching by name (or use the Advanced > Match to Symbols from File... command to bypass the import into the Style Manager):

Before:

b4stylematch

After Advanced > Match to Saved Symbols:

Matchingreport

afterstylematch

This style will then show up in the legend without any additional work as it is now the style associated with that category. Now the styles are in your library, they can be reused with any features using the same unit naming.

3
  • Building on Andy's approach, you could (if you wanted to) store the layers in a gpkg file, and save the style you create as a style in the gpkg. It will then be part of a standard style table called layer_styles (with no geometry). You can then manually (in QGIS attribute editor) or via any SQL database tools duplicate and edit the style(s), attach as default to different layers.
    – Houska
    Commented Mar 14, 2019 at 15:27
  • Thanks! This got me going forward again (see edits to the question). Unfortunately the sheer volume of categories make individual editing a major chore, so there is hopefully another method.
    – Nick_W
    Commented Mar 16, 2019 at 1:55
  • Taking this approach, or your revised QML based approach, you could script the generation of the 2150 styles using a loop through the BC master list, each time taking the template XML, and replacing the name and fill colour before appending it to the end of the output file. This could be done in many languages including Python, or Windows Powershell. Commented Mar 18, 2019 at 9:27
2

You can achieve this by importing the colors as a color ramp. First categorize your layer the way you want. Then:

  1. Save an new (empty or just create some random values. This step is just to get an empty, working .gpl-file) color ramp from the QGIS Layer styling (.gpl-file)
  2. In a spreadsheet, order your legend entries in the same order as your categories in QGIS (i.e. by increasing stratigraphic order). Copy the color values to clipboard.
  3. In a text editor, paste the r g b-values (space between r g b) into the empty color ramp-file.
  4. Open this new color ramp in the QGIS Layer styling for that layer
  5. You have correct colors in the legend. Also negates the need for data defined colors. You can save the .qml style together with your data for easy re-use.

This does not work if several units have the same color.

1
  • Thanks! This was really useful and helped a lot (see edits to question). Unfortunately there are some layer naming issues; the unique field (strat_unit) is a code (i.e. CCCmbY) rather than a regular name (i.e. "Atlin Group"), and the regular names are not unique- some have slightly different shades of colour.
    – Nick_W
    Commented Mar 16, 2019 at 1:57

Your Answer

By clicking “Post Your Answer”, you agree to our terms of service and acknowledge you have read our privacy policy.

Not the answer you're looking for? Browse other questions tagged or ask your own question.