6

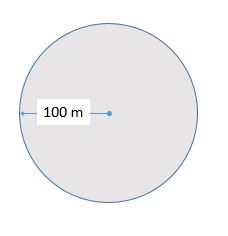
I have to draw the geometrical shapes with their dimensions and show it with that shape.

As in below images,

Rectangle with Length and Width

Circle with Radius

  1. I want to show the length and width of the rectangle, the radius of the circle and the area of the shape at centre.

  2. If the user selects and edits the geometrical shapes then the dimensions should be updated accordingly.

I have read the below examples, but I couldn't able to find the proper one.

  1. Add graphics to a map | ArcGIS API for JavaScript 3.25

  2. Drawing tools | ArcGIS API for JavaScript 3.25

  3. Measurement Widget | ArcGIS API for JavaScript 3.25

  4. Reshape polygons | ArcGIS API for JavaScript 3.25

4
  • 1
    Do you want to show the dimensions after the feature is added, or do you want to show them while the user is drawing them in (if applicable)?
    – GavinR
    Commented Sep 13, 2018 at 3:29
  • I want to show the dimensions while the user is drawing them.
    – Kishor
    Commented Sep 17, 2018 at 4:12
  • Your links go to the 3.x samples. Have you decided to use 3.x instead of 4.x, or is that a decision still to be made? Commented Sep 20, 2018 at 6:02
  • @BjornSvensson, 3.x works fine for me, coz entire application written in 3.x only.
    – Kishor
    Commented Sep 24, 2018 at 4:28

1 Answer 1

1

The company I work for created a customized solution to this exact issue, I cannot copy the code but I can give you a guideline:
- Create a variable that indicates 'inDrawing' state
- Create a variable for 'currentPoints'
- Create a graphicLayer for measurements - Create a listener on "mouse-move"/"mouse-drag" event on the map
- If "inDrawing":
- send the mouse position (x,y)
- Add the new point to the array
var movingPoint = new Point(x, y, spatialReference); currentPoints.push(movingPoint);
- If the shape is a polygon add the first point to the end of the points array [please note you should clear the array before the action/splice the last point etc.]
- Iterate on the currentPoint array and:
-- calculate distance between points pair
-- calculate the angle of the line
-- create a graphic text symbol with the distance and the angle
-- add the new graphic to the measurements graphicsLayer
- If the shape is a line and there are more than 3 vertices - add a graphic with total length
- If the shape is a polygon - add a graphic with the shape area

I've skipped some details like clearing layers and variables, I hope the guideline can be helpful nevertheless.

0

Your Answer

By clicking “Post Your Answer”, you agree to our terms of service and acknowledge you have read our privacy policy.

Not the answer you're looking for? Browse other questions tagged or ask your own question.