0

I am using the point cluster symbology in QGIS and have defined the size of each point based on the cluster size using @cluster_size in the size assistant.

It looks great on my map, but I cannot figure out how to add the size symbology for the variable to my legend in the map composer to create a map for a presentation/publication.

1 Answer 1

1

It's not possible to directly display data-defined symbol sizes in a legend. Here's a workaround.

Duplicate the point layer (Layer panel > right click on layer name > Duplicate layer).

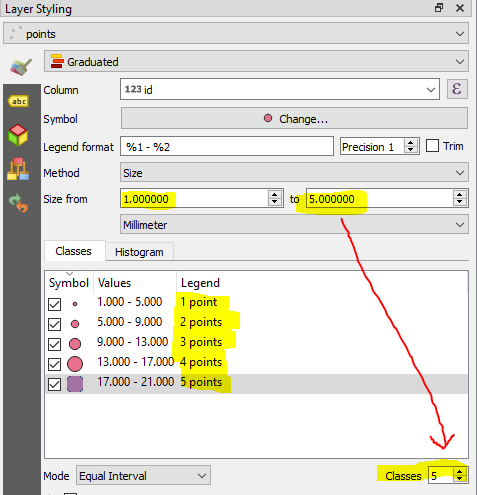
Change symbology of the duplicate layer to "graduated" and for method choose "size."

  • Choose any numerical field for column.
  • Change the "Size from" starting value to 1mm, and the final value to the maximum number of points in a cluster.
  • Change the number of classes to the maximum number of points in a cluster (same as final size value).
  • Click "Classify."
  • Change the legend text as desired, eg "1 point," "2 points" etc.

The style settings for the duplicate layer look like this:
enter image description here

Turn off the duplicate layer so you don't see it on the map.

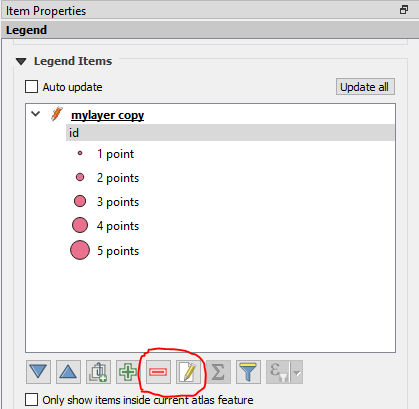
Use the duplicate layer in the print composer legend. The legend looks like this:

enter image description here

You can use the controls under legend items to

  1. Change the way the layer name is displayed: highlight the layer name, click the pencil icon, type in the name of the original layer.
  2. Delete the name of the field from the legend: highlight the field name, click the red minus sign button.
enter image description here

enter image description here

5
  • I think I understand your suggested work around, but unfortunately I can't seem to make it work. My issue is that in the former point cluster layer, I am relying on the geometry of the individual points to create the point size and not a data column from my table, where my understanding of your solution would require me to have a data column associated with the size to generate the graduated symbology?
    – Matt
    Commented Nov 13, 2018 at 20:51
  • How are you relying on the geometry? Are you using the point coordinates? You can get those with the $x and $y variables. Anyway the duplicate layer is linked to the same base data (eg, shapefile), so it has access to the same geometry. The only thing it doesn't have access to is the @cluster_color and @cluster_size variables, which only exist in the context of the cluster renderer.
    – csk
    Commented Nov 14, 2018 at 16:45
  • I see you mentioned in your question that point size is based on @cluster_size. You'll have to manually adjust the values and point sizes in the graduated layer to match the sizes of the point clusters. If your point cluster size is simply @cluster_size in mm, then your legend should read 1 point, 2 points, etc. It doesn't matter what you put in the 'values' for the graduated layer, because you're not actually displaying that layer on the map. Set the 'size from' starting value to 1mm, and the max value to the maximum cluster size.
    – csk
    Commented Nov 14, 2018 at 17:32
  • I edited my answer, hopefully it's easier to understand how to apply it to your data.
    – csk
    Commented Nov 14, 2018 at 17:54
  • Thanks for the response. I manually adjusted the sizes in the graduated layer in mm and that solved my problem. The new figure and legend looks great. Thanks for taking the time to respond and help me out!
    – Matt
    Commented Nov 14, 2018 at 18:14

Your Answer

By clicking “Post Your Answer”, you agree to our terms of service and acknowledge you have read our privacy policy.

Not the answer you're looking for? Browse other questions tagged or ask your own question.