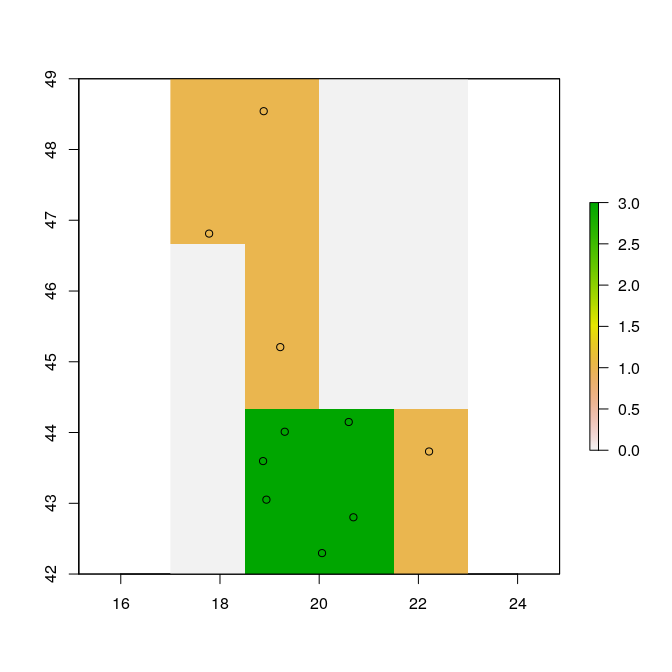
I have a country shapefile and a dataframe with coordinates of bird sightings. My goal is to "rasterize" the shapefile and compute the number of points within each grid cell. Specifically, I want to end up with a grid-cell level dataframe containing lat/long of the centroid of each grid-cell, the district census code of that grid cell (which is contained in the shapefile attribute table), and the number of points falling in the grid cell. I would like to keep cells with no points in them and leave number of points as "NA". This is what I have so far. I get stuck after finding the district code of each cell. I guess the next step is to convert the raster to a polygon grid and then overlay the points on it? Is there an easier way?
# Load Packages
require(data.table)
require(rgdal)
require(rgeos)
require(sp)
require(raster)

# Load india 2011 districts
india.districts.2011 <- readOGR(paste(dist_shpf, "maps/india-district", sep=""),
                            'SDE_DATA_IN_F7DSTRBND_2011', stringsAsFactors = F)
# Read Bird Data
df.sample <- fread('ebd_IN_200001_201810_relOct-2018.txt')

# Initialize Grid
grid <- raster(extent(india.districts.2011))
res(grid) <- .25
proj4string(grid) <- proj4string(india.districts.2011)
india.grid <- rasterToPolygons(grid) #SpatialPolygonsDataFrame

# Get centroids
india.grid.centroids = gCentroid(india.grid ,byid=TRUE)
india.grid.centroids$c_code_2011 <-
over(india.grid.centroids,india.districts.2011)$district.code #SpatialPointsDataFrame

