I am trying to create a raster with Sentinel 3 data. I found out that long/lat coordinates were in a different file than the data (chla). I am using this code to create one raster that I would like to use to extract chla at specific locations.
library(raster)
#> Loading required package: sp

longitude <-
  raster(
    "/media/data4tb/sentinel3/Data to Philippe/S3A_OL_2_WFR____20160608T142332_20160608T142532_20171101T060408_0119_005_096______MR1_R_NT_002.SEN3/geo_coordinates.nc",
    varname = "longitude"
  )
#> Loading required namespace: ncdf4
latitude <-
  raster(
    "/media/data4tb/sentinel3/Data to Philippe/S3A_OL_2_WFR____20160608T142332_20160608T142532_20171101T060408_0119_005_096______MR1_R_NT_002.SEN3/geo_coordinates.nc",
    varname = "latitude"
  )
chla <-
  raster(
    "/media/data4tb/sentinel3/Data to Philippe/S3A_OL_2_WFR____20160608T142332_20160608T142532_20171101T060408_0119_005_096______MR1_R_NT_002.SEN3/chl_oc4me.nc"
  )
#> Warning in .varName(nc, varname, warn = warn): varname used is: CHL_OC4ME
#> If that is not correct, you can set it to one of: CHL_OC4ME, CHL_OC4ME_err

extent(chla) <-
  c(min(values(longitude)), max(values(longitude)), min(values(latitude)), max(values(latitude)))

projection(chla) <-
  CRS("+proj=longlat +datum=WGS84")

wm <- rworldmap::getMap(resolution = "high")
wm <- crop(wm, extent(-180, 180, 45, 90))
#> Loading required namespace: rgeos
#> Warning in RGEOSBinPredFunc(spgeom1, spgeom2, byid, func): spgeom1 and
#> spgeom2 have different proj4 strings
#> Warning in RGEOSBinTopoFunc(spgeom1, spgeom2, byid, id, drop_lower_td,
#> unaryUnion_if_byid_false, : spgeom1 and spgeom2 have different proj4
#> strings
wm <- spTransform(wm, CRSobj = CRS(proj4string(chla)))
I get weird results when plotting data as is:
plot(chla)
plot(wm, add = TRUE)
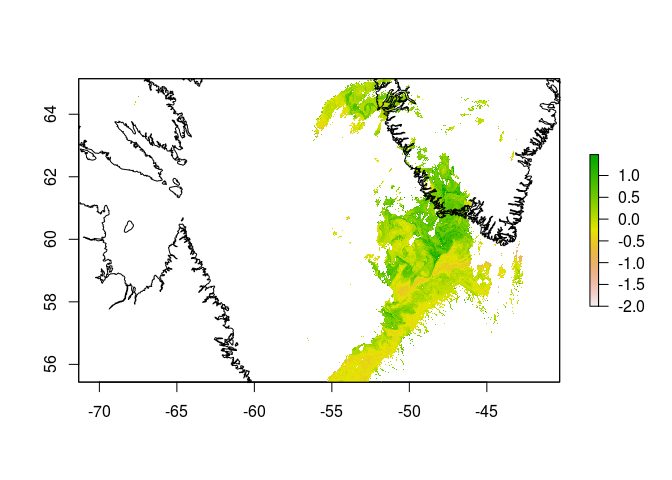
If I flip the data it looks better, but it is not quite there. The data is shifted toward the upper right.
plot(flip(chla, 2))
plot(wm, add = TRUE)
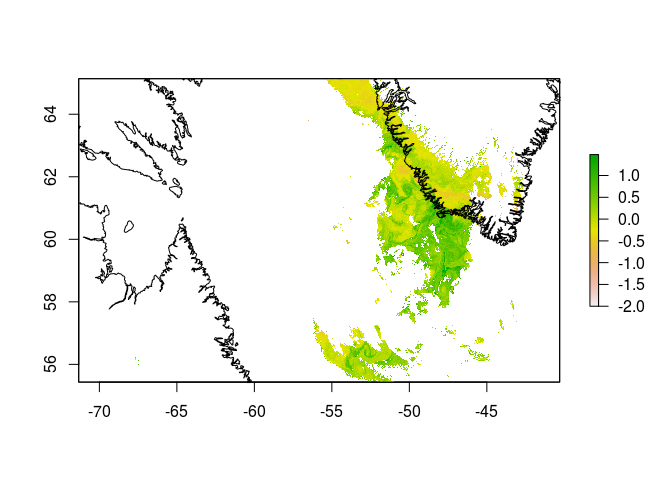
Anyone can spot the mistakes I make?
Update #2
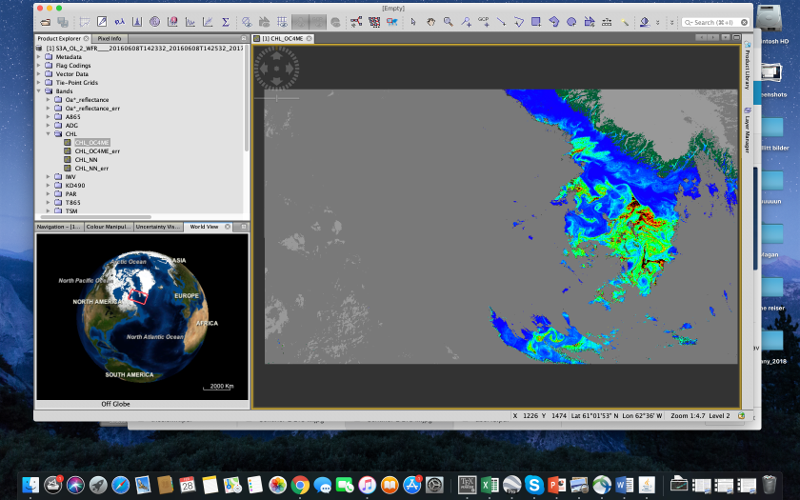
This is what it should look like:
This is the scatterplot between longitude and latitude.
Update #3
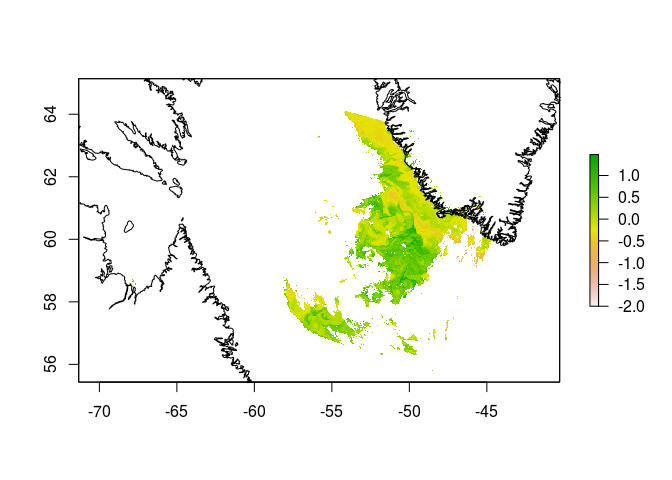
I think I managed to get it to work using the rasterize() function. However, I am still not sure if I do it the right way and how to adequately choose nrow and ncol in the rasterize() function.
library(raster)
#> Loading required package: sp

longitude <-
  raster(
    "/media/data4tb/sentinel3/Data to Philippe/S3A_OL_2_WFR____20160608T142332_20160608T142532_20171101T060408_0119_005_096______MR1_R_NT_002.SEN3/geo_coordinates.nc",
    varname = "longitude"
  )
#> Loading required namespace: ncdf4
latitude <-
  raster(
    "/media/data4tb/sentinel3/Data to Philippe/S3A_OL_2_WFR____20160608T142332_20160608T142532_20171101T060408_0119_005_096______MR1_R_NT_002.SEN3/geo_coordinates.nc",
    varname = "latitude"
  )
chla <-
  raster(
    "/media/data4tb/sentinel3/Data to Philippe/S3A_OL_2_WFR____20160608T142332_20160608T142532_20171101T060408_0119_005_096______MR1_R_NT_002.SEN3/chl_oc4me.nc"
  )
#> Warning in .varName(nc, varname, warn = warn): varname used is: CHL_OC4ME
#> If that is not correct, you can set it to one of: CHL_OC4ME, CHL_OC4ME_err

e <- extent(cbind(values(longitude), values(latitude)))
r <- raster(e, ncol = 1000, nrow = 1000) # How to choose ncol and nrow correctly?

# Remove NA values from chla, faster for the rasterize function.
xyz <- cbind(values(longitude), values(latitude), values(chla))
xyz <- na.omit(xyz)

x <- rasterize(xyz[, 1:2], r, xyz[, 3], fun = mean)
crs(x) <- "+proj=longlat +ellps=WGS84 +datum=WGS84 +no_defs "

# World map

wm <- rworldmap::getMap(resolution = "high")
wm <- crop(wm, extent(-180, 180, 45, 90))
#> Loading required namespace: rgeos
#> Warning in RGEOSBinPredFunc(spgeom1, spgeom2, byid, func): spgeom1 and
#> spgeom2 have different proj4 strings
#> Warning in RGEOSBinTopoFunc(spgeom1, spgeom2, byid, id, drop_lower_td,
#> unaryUnion_if_byid_false, : spgeom1 and spgeom2 have different proj4
#> strings
# wm <- spTransform(wm, CRSobj = CRS(proj4string(chla)))

plot(x)
plot(wm, add = TRUE)

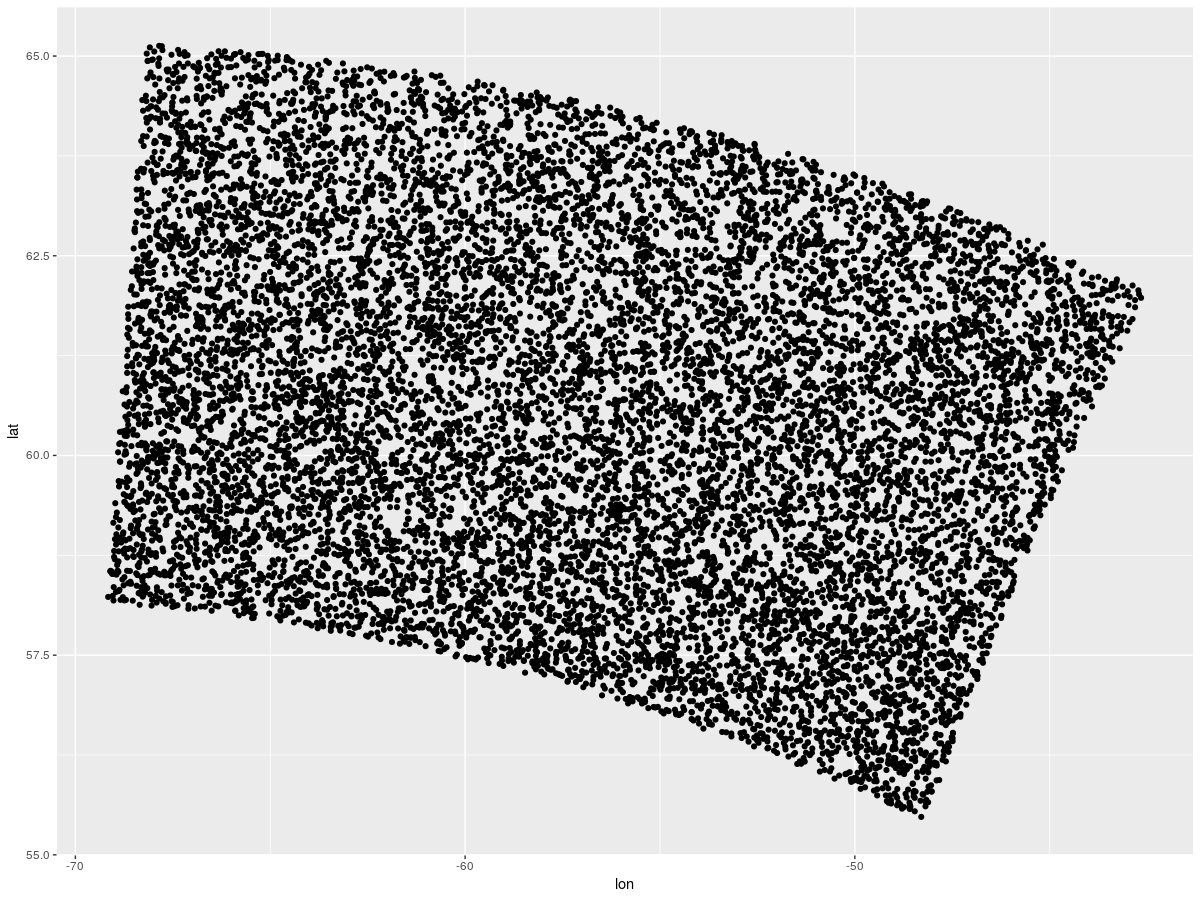
values()of the longitude raster vs the values of the latitude raster - if that's not a regular grid then you cant force the data to a grid based on the min-max as you do now.