1

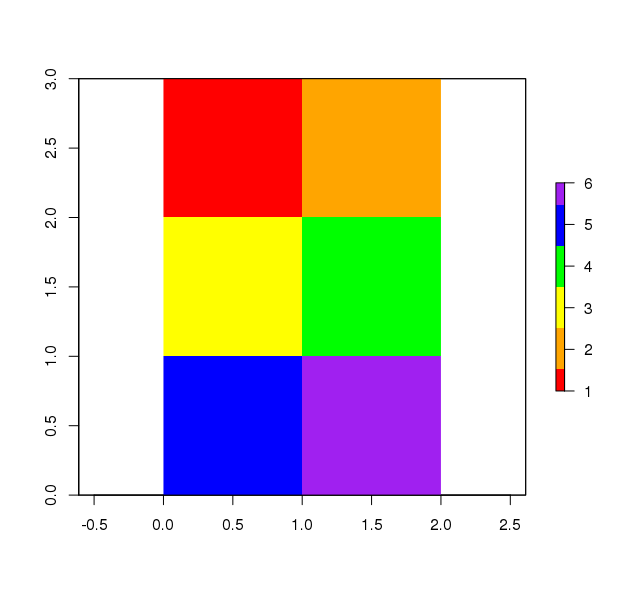
I have a 2x3 raster in R, with values 1 to 6.

library(raster)
r <- raster(nrows=3,ncols=2,xmn=0,xmx=2,ymn=0,ymx=3,vals=1:6)
colors <- c('red','orange','yellow','green','blue','purple')
plot(r,col=colors)

R raster

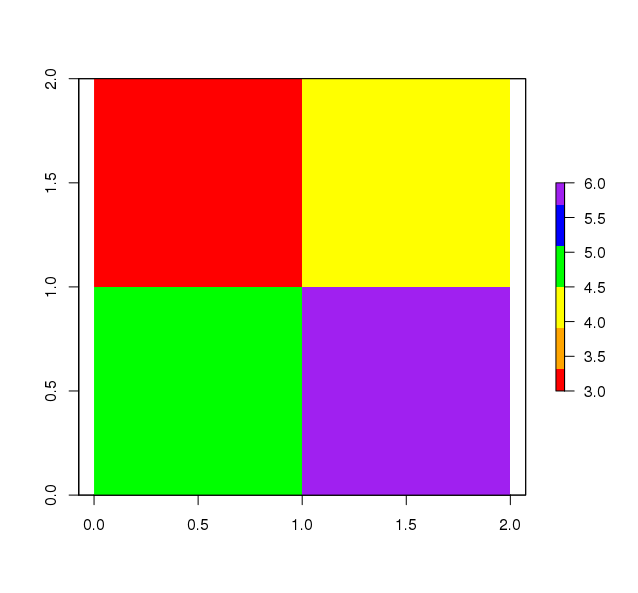
Now if I clip the raster, leaving the first two values out (red and orange), the color palette becomes useless.

r1 <- crop(r,extent(c(0.5,1.5,0.5,1.5)))
plot(r1,col=colors)

R clipped raster

Notice how the extent includes only the colors yellow, green, blue and purple from the first picture. However, these are not the colors in the second picture. The numbers in the raster are correct.

> values(r)
[1] 1 2 3 4 5 6
> values(r1)
[1] 3 4 5 6

How can I use the same color variable (colors) in both cases in a consistent way?

My real world problem is cropping a world raster into country maps, using the same vegetation color code.

7
  • 1
    In the first plot you have an implicit range (zlim) of c(1, 6), so you can get the same result with plot(crop(r,extent(c(0.5,1.5,0.5,1.5))), col = colors, zlim = c(1,6)). Whether that will work with other palette choices is unclear though, you can control more specifically with the breaks argument.
    – mdsumner
    Commented Jun 25, 2019 at 1:06
  • You neeid to look at categorical rasters for mapping when your are representing discrete categories of data rather than possibly continuous numeric values. See help(raster::ratify)
    – Spacedman
    Commented Jun 25, 2019 at 6:36
  • @Spacedman My raster is categorical, with 23 levels. It's the GLC2000 (Global Land Cover) project.
    – Rodrigo
    Commented Jun 26, 2019 at 1:15
  • @mdsumner Thank you, zlim apparently solved my problem.
    – Rodrigo
    Commented Jun 26, 2019 at 1:16
  • The raster you construct in the example has integers in it but R doesn't know it represents categorical data. The raster package supports properly categorical rasters with colour palette information.
    – Spacedman
    Commented Jun 26, 2019 at 8:08

1 Answer 1

1

Building from what @Spacedman said in comments, try ratifying the raster (have a look here and here) and then using levelplot (here and here)

# make your raster
r <- raster(nrows=3,ncols=2,xmn=0,xmx=2,ymn=0,ymx=3,vals=1:6)

# ratify it, set a new colours attribute and put back into the raster
r <- ratify(r)
rat <- levels(r)[[1]]
rat$cols <- c('red','orange','yellow','green','blue','purple')
levels(r) <- rat

# levelplot
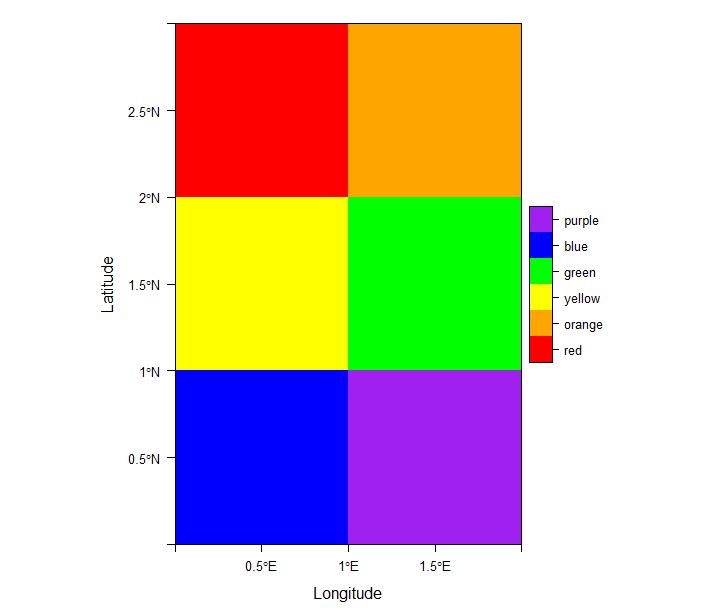
levelplot(r,col.regions=levels(r)[[1]]$cols)

enter image description here

# now crop the ratified raster
r1 <- crop(r,extent(c(0.5,1.5,0.5,1.5)))

# looking at the raster will reveal and value range of 3 to 6 but an 
# attribute table including all original values & associated colours

# plot
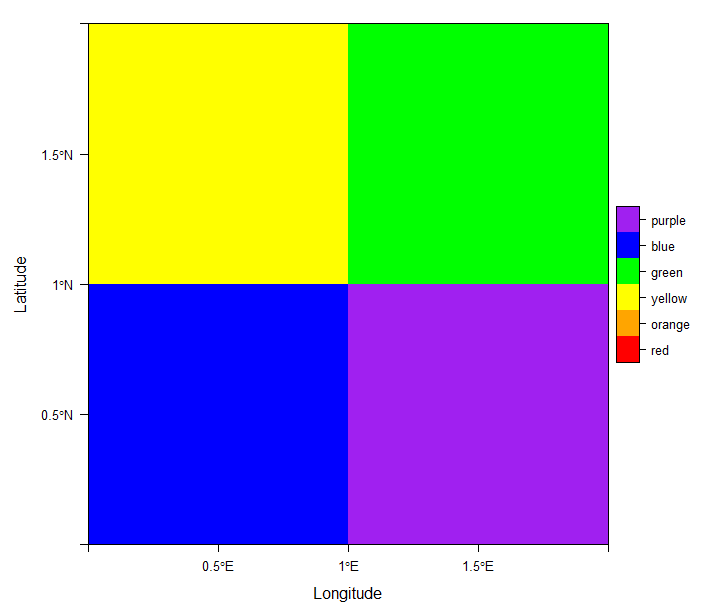
levelplot(r1,col.regions=levels(r1)[[1]]$cols)

enter image description here

fiddling around with levelplot options etc will give you the correct legend

Your Answer

By clicking “Post Your Answer”, you agree to our terms of service and acknowledge you have read our privacy policy.

Not the answer you're looking for? Browse other questions tagged or ask your own question.