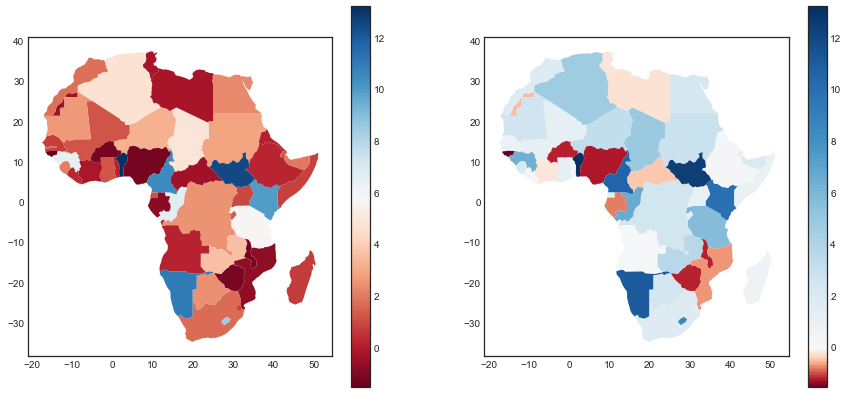
I'm looking to plot a choropleth with a divergent colormap. I need to center the colormap in such a way that the middle color is displayed for a specific value (e.g. 0). How could I do this in GeoPandas/Geoplot?
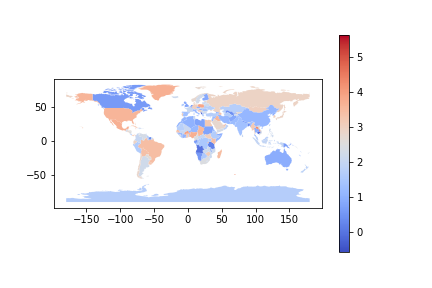
I tried using a normalizer with geopandas.plot() but it's values are reset to data min and max once I plot:
import geopandas as gpd
import matplotlib as mpl
import matplotlib.pyplot as plt
import numpy as np

world = gpd.read_file(gpd.datasets.get_path('naturalearth_lowres'))
world.loc[:,'random'] = np.random.normal(size=len(world))+2

norm = mpl.colors.Normalize(-4,4,clip=True)

fig, ax = plt.subplots()
world.plot('random', cmap=cmap, legend=True, norm=norm, ax=ax)
And here is the figure:


