2

Is it possible in QGIS 3.x to click in two places on the map and to get back the X and Y distances between these two locations (latitude and longitude differences).

I was hoping there is a plugin that does that but couldn't find it.

This would be very helpful.

2 Answers 2

2

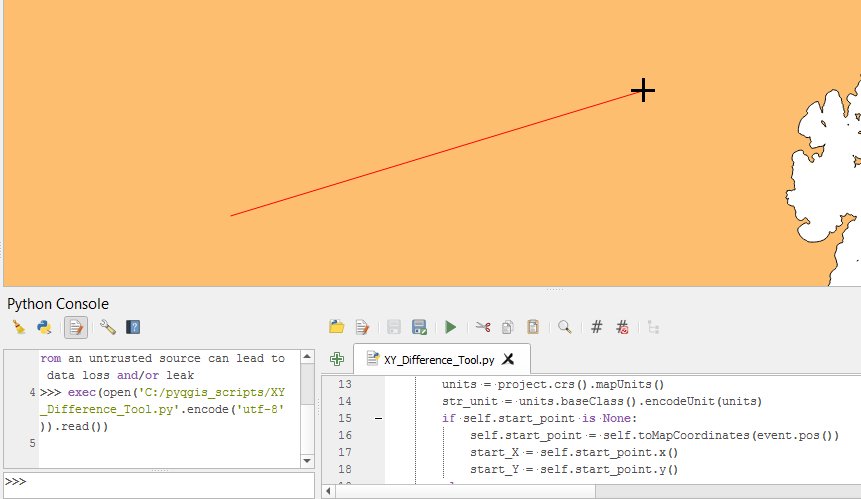
Here is an example code which subclasses QgsMapToolEmitPoint to create a custom map tool which should do what you want. It also implements the QgsRubberBand class to draw a temporary line on the map canvas to track your start and endpoints. You can paste this script into a new editor in the python console and click 'Run script'. You will see the cursor is now a cross. When you click once on the map canvas you can then move the cursor around and you will see a red line following your cursor like this:

example

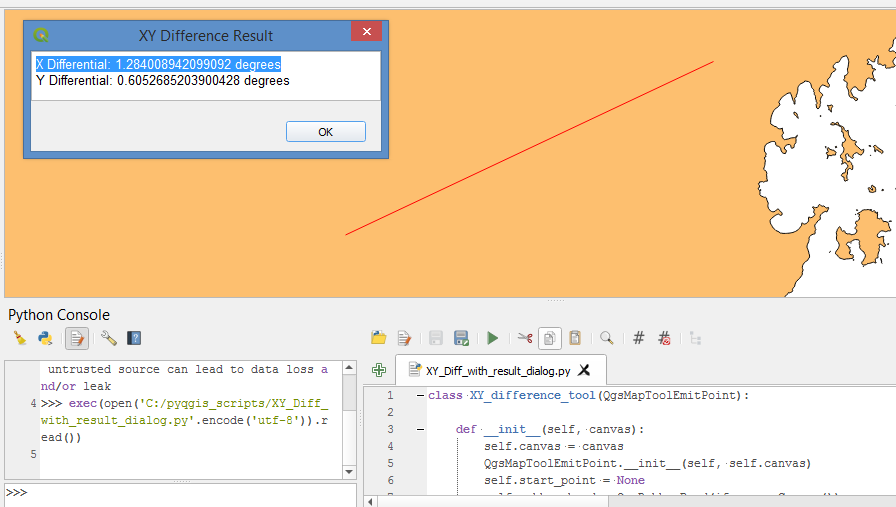
On the second canvas click, you will get a dialog box showing the x and y difference values in the current project CRS map units like so:

enter image description here

Because we are using a QT Dialog Box with a Text Edit widget to display the results, we are now able to copy and paste the result values. The text edit is set to read-only so you can't inadvertently edit the results.

When you click OK on the dialog box, the rubber band will be reset and you can keep clicking your two points as many times as you want.

To deactivate this custom tool, just select a different map tool from the map navigation toolbar.

Note: In this code, I subtract the start x and y from the end x and y. This returns a positive difference value if the x or y value increases and a negative difference if x or y value decreases. For example- if the endpoint is north-east of the start point you will get positive difference values to reflect the increase in latitude (y) and longitude (x). You could change the calculation if you want but this makes sense to me.

class XY_difference_tool(QgsMapToolEmitPoint):

    def __init__(self, canvas):
        self.canvas = canvas
        QgsMapToolEmitPoint.__init__(self, self.canvas)
        self.start_point = None
        self.rubber_band = QgsRubberBand(iface.mapCanvas())
        self.rubber_band.setColor(QColor(Qt.red))
        self.rubber_band.reset()

    def canvasPressEvent(self, event):
        project = QgsProject().instance()
        units = project.crs().mapUnits()
        str_unit = units.baseClass().encodeUnit(units)
        if self.start_point is None:
            self.start_point = self.toMapCoordinates(event.pos())
            start_X = self.start_point.x()
            start_Y = self.start_point.y()
        else:
            start_X = self.start_point.x()
            start_Y = self.start_point.y() 
            end_point = self.toMapCoordinates(event.pos())
            end_X = end_point.x()
            end_Y = end_point.y()
            self.result = result_dialog()
            self.result.result_box.setText('X Differential: {} {}\nY Differential: {} {}'.format(end_X - start_X, str_unit, end_Y - start_Y, str_unit))
            self.result.show()
            self.result.btn_ok.clicked.connect(self.msg_accepted)

    def msg_accepted(self):
        self.result.close()
        self.rubber_band.reset()
        self.start_point = None

    def canvasMoveEvent(self, event):
        if self.start_point is not None:
            self.rubber_band.reset()
            v1 = self.start_point
            v2 = self.toMapCoordinates(event.pos())
            self.rubber_band.addPoint(v1)
            self.rubber_band.addPoint(v2)

class result_dialog(QDialog):
    def __init__(self, Parent=None):
        QDialog.__init__(self)
        self.setAttribute(Qt.WA_DeleteOnClose)
        self.setModal(True)
        self.setGeometry(150, 150, 350, 100)
        self.setWindowTitle('XY Difference Result')
        self.result_box = QTextEdit(self)
        self.result_box.resize(350, 50)
        self.result_box.setFont(QFont('Arial', 10))
        self.result_box.setReadOnly(True)
        #self.result_box.setText('Test line 1\nTest Line 2')
        self.btn_ok = QPushButton('OK', self)
        self.btn_ok.move(255, 70)

T = XY_difference_tool(iface.mapCanvas())
iface.mapCanvas().setMapTool(T)
7
  • 2
    Great script! Is it possible to do as for the "Lat lon Tools" plugin where the coordinates are automatically stored in the clipboard? As I need to reuse the coordinates differences this would be very useful.
    – ZKB
    Commented Aug 11, 2019 at 12:59
  • 2
    For those as me who are not familiar with the Python console : you have to open the script editor, create a new script, save it with the name XY_difference_tool, copy-paste the code inside of the scritp and then run the script.
    – ZKB
    Commented Aug 11, 2019 at 13:02
  • Thanks @ZKB, I am glad you find this useful. Please see my edited answer for new & improved code which uses a dialog box with text edit to display the results instead of a message box. They are not automatically stored in the clipboard, but you can manually copy and paste the values directly from the result dialog. BTW, if you save the script as a .py file, it doesn't matter what file name you use- you can call it anything you like!
    – Ben W
    Commented Aug 12, 2019 at 0:40
  • Thanks @Ben W for your update. It doesn't matters if the results are not stored in the clipboard. What I usually do is copy the x difference and paste it into another routine, then do the same for y difference. With the dialog box, the problem is that I have to close it first if I want to paste a value into another routine, meaning that I have to copy all its content, paste it somewhere else (like notepad), click OK to close the dialog box and then copy x and then y differences into the next routine. Is it possible to copy paste into another routine without closing the dialog box?
    – ZKB
    Commented Aug 12, 2019 at 7:22
  • 1
    @ZKB, I have been busy for the last few days, but I have had a chance to tweak the code again. Rather than editing the answer again, since the answer solves well your question as it was originally asked, I have put the reworked code on github. You can access it here: github.com/benwirf/PyQgis/blob/master/XY_Difference_Tool_0.3.py This version will allow you to copy and paste the X and Y results without closing the result dialog widget.
    – Ben W
    Commented Aug 16, 2019 at 3:16
1

Create a scratch layer (line).

Apply a label with this expression:

 'dy = ' ||  to_string( y(start_point( $geometry))-y(end_point( $geometry))) || ' , dx = ' ||  to_string( x(start_point( $geometry))-x(end_point( $geometry)))

It will look like: dy = -0.7004608294930876 , dx = -0.9370199692780339.

You can change the text as you want, eg if you want it to look like Change in Latitude = -0.7004608294930876 degrees, Change in Longitude = -0.9370199692780339 degrees, use

 'Change in Latitude = ' ||  to_string( y(start_point( $geometry))-y(end_point( $geometry))) || ' degrees' || ', Change in Longitude = ' ||  to_string( x(start_point( $geometry))-x(end_point( $geometry))) || ' degrees'

Use the round() function if you want fewer decimal places.

Optional: if you want to see the coordinates of the start and end points, change to rule-based labeling and create two new rules:

First rule, label with this expression:

 y(end_point( $geometry)) || ' , '|| x(end_point( $geometry))

Notice that the coordinate order; Y comes first because Y is latitude and X is longitude. If you wanted labels for easting and northing, reverse the order.

Data-defined placement for first rule: X = x(end_point( $geometry)) and Y = y(end_point( $geometry))

For the second rule, duplicate the first rule and substitute start_point every place where end_point was used.

When you want to measure the change in lat/long between two points, simply create a line feature between those two points. Because this is a scratch layer, any line features you create will be automatically deleted when you close the QGIS project. You can also clear them at any time by rolling back edits on the layer.
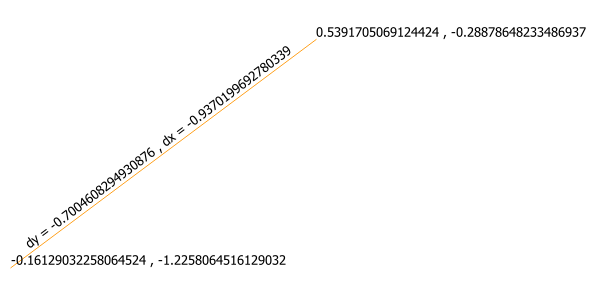
enter image description here

If you want to be able to copy the dy and dx values, use the field calculator to add a virtual field for dy and one for dx. Copy the dy and dx values from the Identify tool.

Your Answer

By clicking “Post Your Answer”, you agree to our terms of service and acknowledge you have read our privacy policy.

Not the answer you're looking for? Browse other questions tagged or ask your own question.