1

I downloaded the Los Angeles Parcels Tax Roll data into QGIS. I copied the information for a single parcel results in QGIS:

wkt_geom OBJECTID_1 AIN Roll_Year AssessorID TaxRateArea TaxRateArea_CITY SitusHouseNo SitusFraction SitusDirection SitusStreet SitusUnit SitusConcatenated SitusCity SitusZIP SitusZIP5 UseCode UseCodeDescChar1 UseCodeDescChar2 UseCodeDescChar3 UseCodeDescChar4 totBuildingDataLines YearBuilt EffectiveYearBuilt SQFTmain Bedrooms Bathrooms Units RecordingDate Roll_LandValue Roll_LandBaseYear Roll_ImpValue Roll_ImpBaseYear Roll_totLandImp Roll_PersPropValue Roll_FixtureValue Roll_HomeOwnersExemp ExemptionClaimKey ExemptionType ExemptionFullOrPartial Roll_RealEstateExemp Roll_PersPropExemp Roll_FixtureExemp netTaxableValue__Land_Imp_REX_HOX_ totBoundaryDescLines BoundaryDescLine1 BoundaryDescLine2 BoundaryDescLine3 BoundaryDescLine4 BoundaryDescLine5 BoundaryDescLastLine ParcelClassification AdministrativeRegion CENTER_LAT CENTER_LON Shape_Length Shape_Area MultiPolygon ((( 6445171.31999936699867249 1754319.45000045001506805 6445165.38999937474727631 1754259.7400003969669342 6445040.50999936461448669 1754272.15000040829181671 6445043.06999936699867249 1754297.81000044941902161 6445046.4499993622303009 1754331.86000040173530579 6445171.31999936699867249 1754319.45000045001506805 ))) 539190 7514021016 2014 7514-021-016 9359 TORRANCE 249 PASEO DE LAS DELICIAS 249 PASEO DE LAS DELICIAS TORRANCE CA 90277-6439 90277 0100 Residential Single Family Residence Unused or Unknown Code (No Meaning) 1 1948 1948 1456 3 2 1 19900220 70378 1975 34771 1975 105149 0 0 7000 0 0 0 98149 1 TRACT # 10302 LOT 16 BLK N 14 33.81230373 -118.38371317 370.98874200978423 7529.721003203928

What are the units of the multipolygon? My QGIS is set to EPSG: 3857. Although I think the units for the MultiPolygon are the same no matter what CRS is used.

And then how do I get just this parcel into QGIS. The database is rather large and I don't need it all.

5
  • 1) The CRS wasn't indicated when you downloaded the file ? 2) Filtering a csv is quite a common task (in qgis or in a spreadsheet) : what would be your criteria ?
    – Snaileater
    Commented Sep 2, 2019 at 7:21
  • @snaileater. They <egis3.lacounty.gov/dataportal/2017/12/12/…> don't say, but much of the data is in EPSG: 2229. The download links states "ESRI file geodatabase" and the downloaded folder is "Parcels_2016.gdb." All of the real estate entities for Los Angeles County are in the file. When you load it into QGIS and info click on one parcel the "identify results" are those shown in original posting. But this comes up the same no matter what the projection used is. I don't understand your second question.
    – Greg
    Commented Sep 2, 2019 at 16:16
  • You say "i dont need it all" : i suppose you just want a subset of the initial dataset ? How do u intend to filter those datas ?
    – Snaileater
    Commented Sep 2, 2019 at 16:30
  • All I want is to get the single parcel boundary into QGIS MultiPolygon ((( 6445171.31999936699867249 1754319.45000045001506805 6445165.38999937474727631 1754259.7400003969669342 6445040.50999936461448669 1754272.15000040829181671 6445043.06999936699867249 1754297.81000044941902161 6445046.4499993622303009 1754331.86000040173530579 6445171.31999936699867249 1754319.45000045001506805 ))) and read the coordinates in units I can understand, e.g., EPSG: 4326.
    – Greg
    Commented Sep 2, 2019 at 16:36
  • I should add that although the information is marked MultiPolygon (I assume for their general case), the data I'm interested in is just a Polygon.
    – Greg
    Commented Sep 2, 2019 at 18:14

1 Answer 1

1

This answer assumes that you've correctly identified the CRS of this data as EPSG:2229.

  1. Import the CSV into QGIS in its native CRS, EPSG:2229.

  2. Select the one parcel you want to keep.

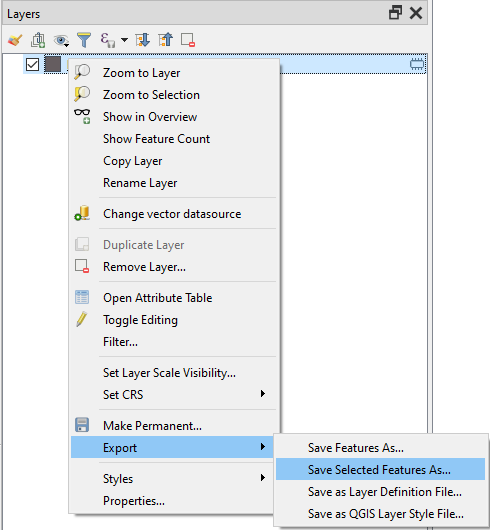
  3. Export that parcel by right-clicking on the layer name > Export > Save selected features as...

    enter image description here

  4. Save it in the CRS you want (eg, EPSG: 4326).

  5. QGIS has many tools you can use to extract the geometric data you want. Eg, you can get the polygon vertex coordinates by using the Field Calculator to add a long text field with the geom_to_wkt($geometry) function.

2
  • Thank you. Most critical was 2. Selecting the parcel. I thought I had been doing that with Info, but then you lead me to look further: Edit > Select > Select Feature. I exported as geojson since it's easy to read. But I don't understand why "geometry" isn't shown as an export field although there is a section for geometry in the window that appears, so guess that's it. And exporting automatically puts in the selection as a layer which is nice. I'll look at 5 which might be more to the point. But now I have the individual parcel which loads much faster than all of them.
    – Greg
    Commented Sep 4, 2019 at 2:55
  • That's standard convention for how mapping programs handle geospatial data. The geometry is displayed on map, so for most use-cases you don't need to see it as text. If you need it in WKT format you can always access it through the field calculator as I described. Or if you export it to CSV, the geometry will be stored in a column that you can see in Excel.
    – csk
    Commented Sep 4, 2019 at 16:57

Your Answer

By clicking “Post Your Answer”, you agree to our terms of service and acknowledge you have read our privacy policy.

Not the answer you're looking for? Browse other questions tagged or ask your own question.