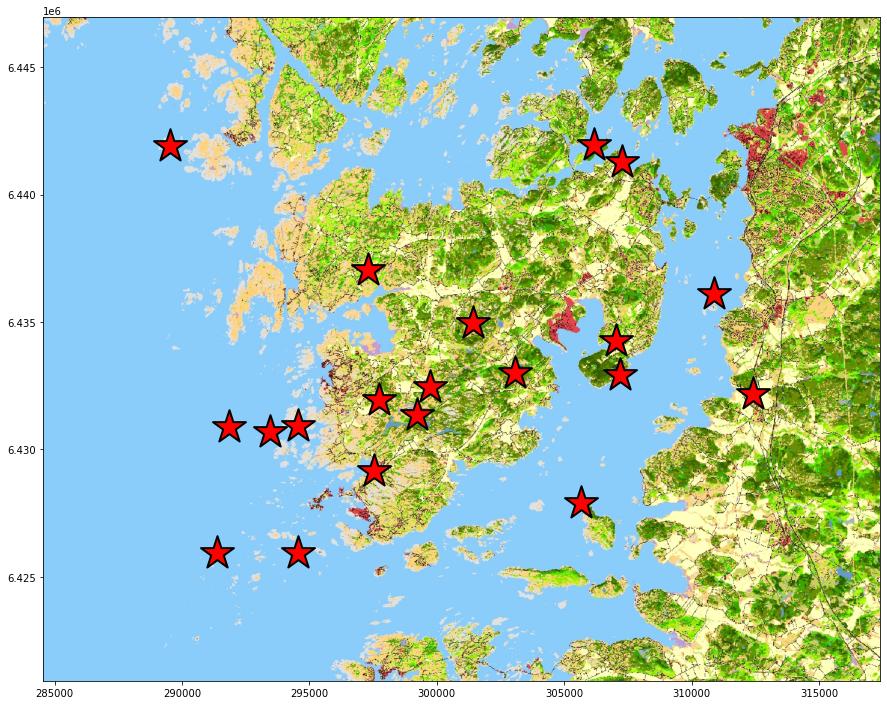
You can use owslib to fetch an image from the wms, and plot using rasterio.plot:
import geopandas as gpd
from owslib.wms import WebMapService
import matplotlib.pyplot as plt
#import rasterio
import rasterio.plot

#Create a point geodataframe
xcoords = [294548, 306184, 310893, 299722, 289543, 297529, 301431, 305647, 312393, 291863, 291361, 307208, 297281, 303063, 299224, 294557, 293444, 307253, 307032, 297730]
ycoords = [6425918, 6441955, 6436112, 6432466, 6441927, 6429135, 6434962, 6427894, 6432167, 6430873, 6425937, 6432921, 6437047, 6433008, 6431334, 6430926, 6430673, 6441293, 6434270, 6431943]
geometries = gpd.points_from_xy(x=xcoords, y=ycoords, crs="EPSG:3006")
df = gpd.GeoDataFrame(geometry=geometries, crs="EPSG:3006")

#Read a wms service layer and save as a temporary file
tempfile = r"/home/bera/Desktop/gistest/wmstemp.tif" #path to save the image fetched from the wms service

wmsurl = "https://geodata.naturvardsverket.se/inspire/lc-nmd/wms" #A Swedish land cover service
wms = WebMapService(wmsurl)
layers = list(wms.contents)
#['LC.LandCoverRaster.Bas', 'LC.LandCoverRaster.LagFjallskog', 'LC.LandCoverRaster.Produktivitet']
#print(wms.getOperationByName('GetMap').formatOptions)
#'image/geotiff'
my_layer = wms['LC.LandCoverRaster.Bas'] #This is the layer I want to use
print(my_layer.boundingBox)
#(208450.0, 6091140.0, 921180.0, 7671060.0, 'EPSG:3006')
print(my_layer.styles)
#'LC.LandCoverRaster': {'title': 'Legend NMD', 'legend': 'http://geodata.naturvardsverket.se/geoserver/lc-nmd/wms?request=GetLegendGraphic&format=image%2Fpng&width=388&height=561&layer=LC.LandCoverRaster.Bas'}}

#Download an image using a bounding box from the dataframe
xMin, yMin, xMax, yMax = df.buffer(5000).total_bounds #I want a 5 km buffer around the points
img = wms.getmap(layers=['LC.LandCoverRaster.Bas'],
                    styles=['LC.LandCoverRaster'],
                    srs='EPSG:3006',
                    bbox=(xMin, yMin, xMax, yMax),
                    size=(1920, 1080),
                    format='image/geotiff')
out = open(tempfile, 'wb')
_ = out.write(img.read())

#Plot
wms_image = rasterio.open(tempfile)
fig, ax = plt.subplots(figsize=(15, 15))
rasterio.plot.show(wms_image, ax=ax)
df.plot(ax=ax, marker="*", color="red", edgecolor="black", linewidths=2, markersize=1200)


