4

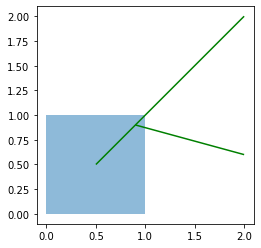
I wanted to clip lines with polygon geometry:

from shapely.geometry import Polygon, LineString
import geopandas as gpd

polygon = Polygon([(0, 0), (1, 0), (1, 1), (0, 1), (0, 0)])
line1 = LineString([(0.5, 0.5), (2, 2)])
line2 = LineString([(0.9, 0.9), (2, 0.6)])


poly_gdf = gpd.GeoDataFrame(geometry=[polygon])
line_gdf = gpd.GeoDataFrame(geometry=[line1, line2])

fig, ax = plt.subplots()
poly_gdf.plot(ax=ax, alpha=0.5)
line_gdf.plot(ax=ax, color='green')

enter image description here

When I do it with:

gpd.overlay(line_gdf, poly_gdf, how='difference')

The result is:

TypeError: overlay only takes GeoDataFrames with (multi)polygon  geometries.
1
  • This question looks answered but you haven't accepted an answer yet. Please can you do this? Commented Mar 17, 2020 at 16:04

3 Answers 3

2

Reference documentation of geopandas.overlay and error message are clear:

TypeError: overlay only takes GeoDataFrames with (multi)polygon  geometries

So, I modified your code for including a second polygon:

from shapely.geometry import Polygon, LineString
import geopandas as gpd
from matplotlib import pyplot as plt

polygon1 = Polygon([(0, 0), (1, 0), (1, 1), (0, 1), (0, 0)])
polygon2 = Polygon([(0.5, 0.5), (1.5, 0.5), (1, 1), (0, 1), (0.5, 0.5)])
line1 = LineString([(0.5, 0.5), (2, 2)])
line2 = LineString([(0.9, 0.9), (2, 0.6)])

poly_gdf1 = gpd.GeoDataFrame(geometry=[polygon1])
poly_gdf2 = gpd.GeoDataFrame(geometry=[polygon2])
line_gdf = gpd.GeoDataFrame(geometry=[line1, line2])

overlay = gpd.overlay(poly_gdf1, poly_gdf2, how='difference')

plt.ion()

fig, ax = plt.subplots()
poly_gdf1.plot(ax=ax, alpha=0.5)
poly_gdf2.plot(ax=ax, alpha=0.5)
overlay.plot(ax=ax, color='red', alpha=0.5)
line_gdf.plot(ax=ax, color='green')

and result (red area) of overlay with two polygons is produced without any error:
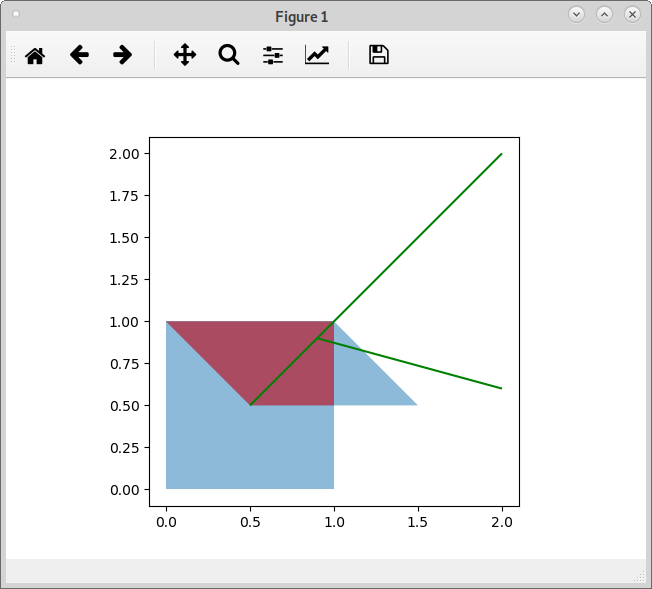
enter image description here

On the other hand, if you want to clip lines with polygon geometry you can use intersection or difference as in following script:

from shapely.geometry import Polygon, LineString
import geopandas as gpd
from matplotlib import pyplot as plt

polygon1 = Polygon([(0, 0), (1, 0), (1, 1), (0, 1), (0, 0)])

line1 = LineString([(0.5, 0.5), (2, 2)])
line2 = LineString([(0.9, 0.9), (2, 0.6)])

poly_gdf1 = gpd.GeoDataFrame(geometry=[polygon1])
line_gdf = gpd.GeoDataFrame(geometry=[line1])

plt.ion()

fig, ax = plt.subplots()
poly_gdf1.plot(ax=ax, alpha=0.1)

difference = line_gdf.difference(poly_gdf1)
intersection = line_gdf.intersection(poly_gdf1)

difference.plot(ax=ax, alpha=0.5, color='magenta')
intersection.plot(ax=ax, alpha=0.5, color='green')

Result is presented in following image:
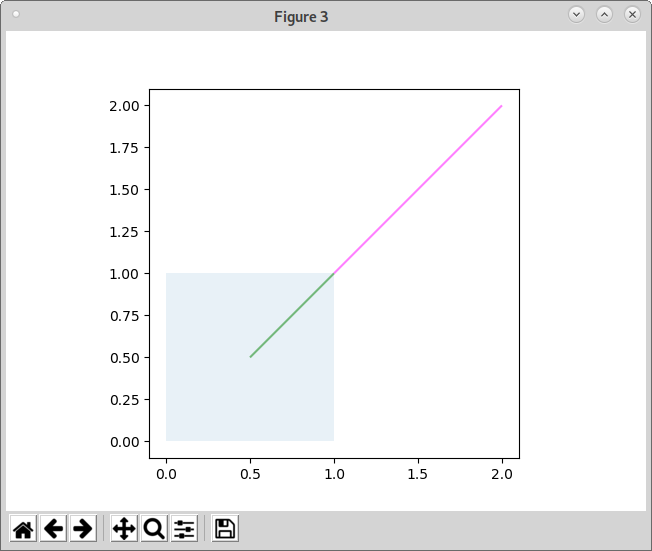
enter image description here

1

Wonderfull Xunilk, now a variation for all lines:

from shapely.geometry import Polygon, LineString
import geopandas as gpd
from matplotlib import pyplot as plt

polygon = Polygon([(0, 0), (1, 0), (1, 1), (0, 1), (0, 0)])
line1 = LineString([(0.5, 0.5), (2, 2)])
line2 = LineString([(0.9, 0.9), (2, 0.6)])


poly_gdf = gpd.GeoDataFrame(geometry=[polygon])
line_gdf = gpd.GeoDataFrame(geometry=[line1, line2])
lineas_geo=gpd.GeoDataFrame(geometry=[line_gdf.unary_union])

fig, ax = plt.subplots()
poly_gdf.plot(ax=ax, alpha=0.5)
line_gdf.plot(ax=ax, color='green')

difference = line_gdf.difference(poly_gdf)
intersection = line_gdf.intersection(poly_gdf)

difference.plot(ax=ax, alpha=0.5, color='magenta')
intersection.plot(ax=ax, alpha=0.5, color='red')

lineas_geo.intersection(poly_gdf).plot(ax=ax, alpha=1, ls='--',color='pink',lw=5)
0

The original error appears resolved in geopandas 0.13.0.

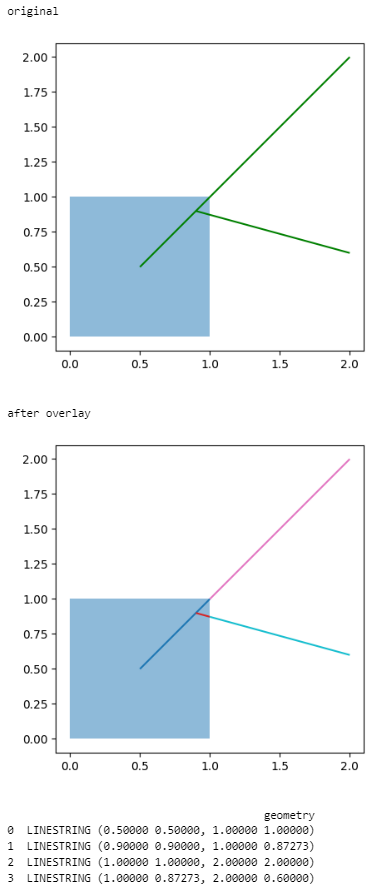
Here's the complete example code for anyone who stumbles on this like I did, looking to split lines to polygon(s).

from shapely.geometry import Polygon, LineString
import geopandas as gpd
from matplotlib import pyplot as plt

# setup mock data
polygon = Polygon([(0, 0), (1, 0), (1, 1), (0, 1), (0, 0)])
line1 = LineString([(0.5, 0.5), (2, 2)])
line2 = LineString([(0.9, 0.9), (2, 0.6)])

poly_gdf = gpd.GeoDataFrame(geometry=[polygon])
line_gdf = gpd.GeoDataFrame(geometry=[line1, line2])

# clip lines at polygon instersections
overlay_results = line_gdf.overlay(poly_gdf1, "union")
# note, change the operator from "union" if you only want difference or intersection.
# "union" will "split" but does not "clip"

# show results
print("original")
fig, ax = plt.subplots()
poly_gdf.plot(ax=ax, alpha=0.5)
line_gdf.plot(ax=ax, color='green')
plt.show();

print("after overlay")
fig, ax = plt.subplots()
overlay_results.plot(ax=ax, column="geometry")
poly_gdf1.plot(ax=ax, alpha=0.5)
plt.show();

print(overlay)

enter image description here

Your Answer

By clicking “Post Your Answer”, you agree to our terms of service and acknowledge you have read our privacy policy.

Not the answer you're looking for? Browse other questions tagged or ask your own question.