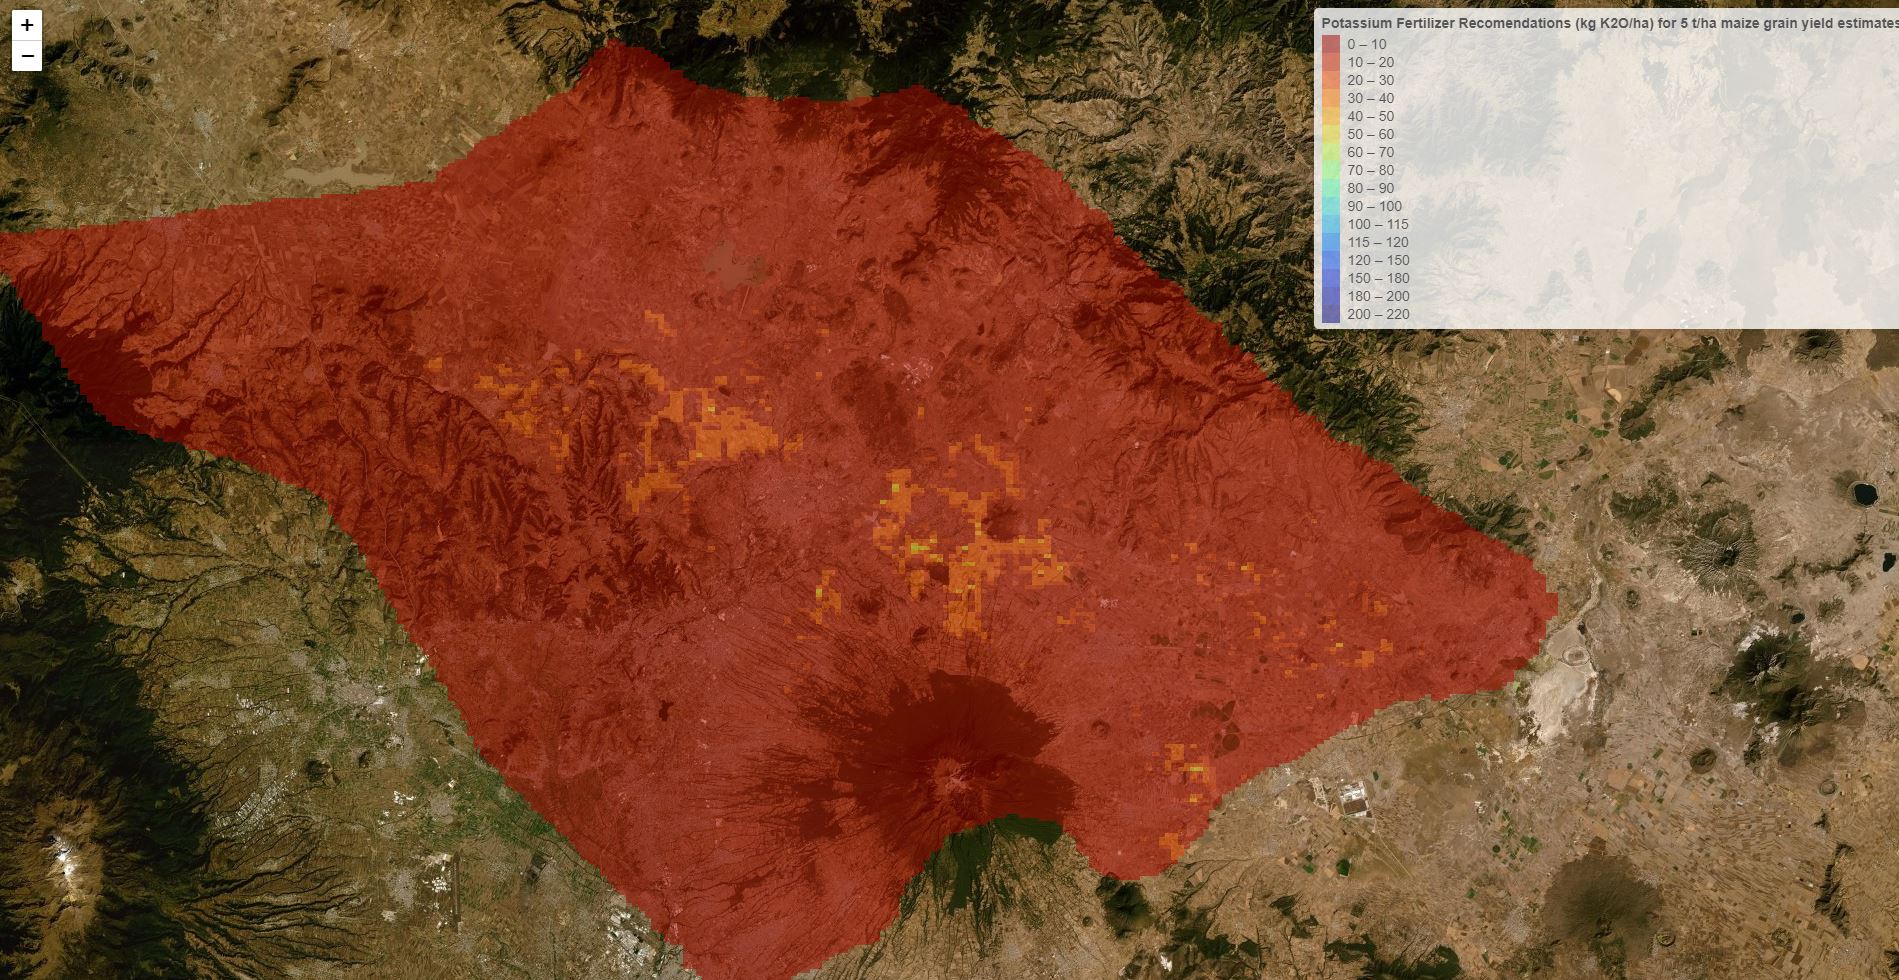
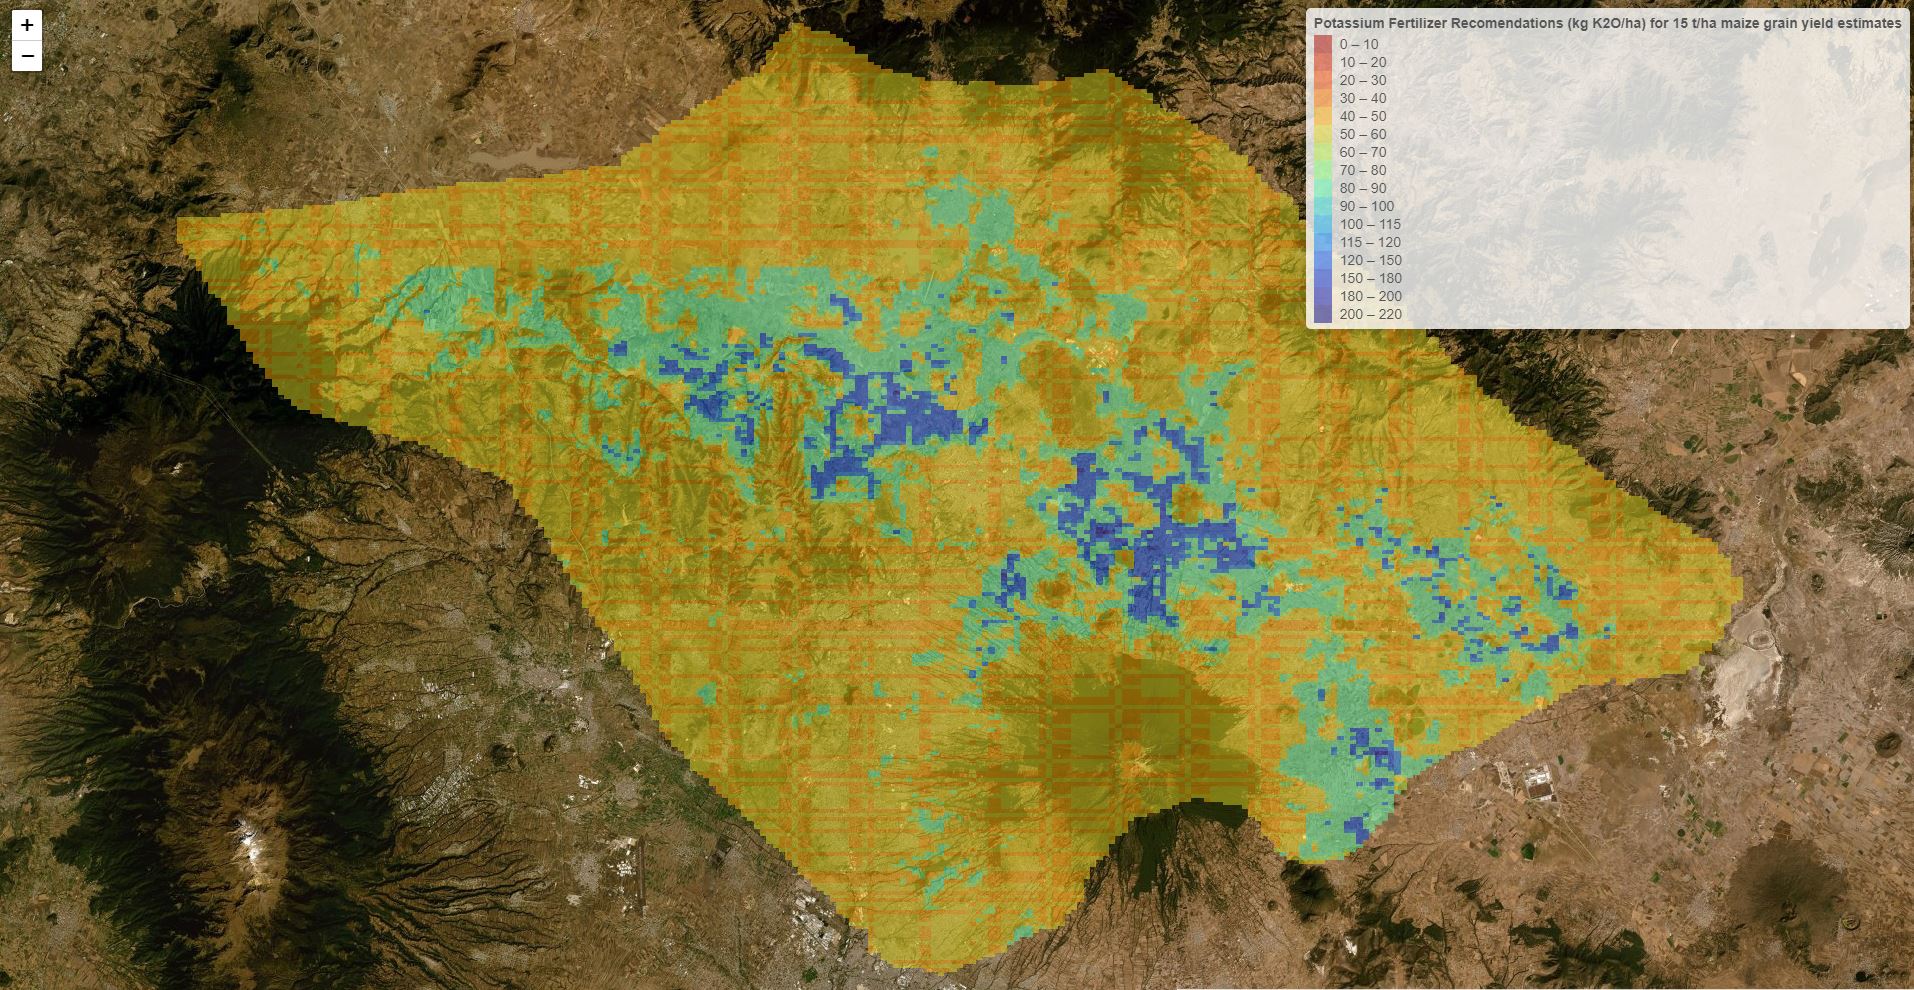
I have been creating leaflet maps from raster files with discrete values. Leaflet creates smooth maps form some of the rasters, but in other there is a strange pattern of geometric striations across the map. All of the rasters were derived from one original raster. In addition, the source raster files used to create the leaflet maps do not have this strange pattern.
Below is the code:
This code chunk creates the 'expected' maps
f <- function(r) {
  ifelse(r <= 100, 50,
         ifelse(r >= 100 & r < 150, 20,
                    ifelse(r >= 150, 0, NA)))
}

r1 <- calc(r, fun = f)

writeRaster(r1, overwrite=TRUE, 'filePath/r1.tif')

r1 <- projectRasterForLeaflet(r1, method = 'ngb')

pal_r1 <- colorBin(SAGA_pal[[1]], values(r1), bins = c(0,10,20,30,40,50,60,70,80,90,100,115,120,150,180,200,220), na.color = "transparent", reverse=TRUE)

(ll_r1 <- leaflet() %>%
    addProviderTiles("Esri.WorldImagery") %>%
    addRasterImage(r1, colors=pal_r1, opacity=0.5) %>%
    addLegend(pal=pal_r1, values=values(r1), title="r1")
)
This code chunk creates the strange pattern:
f <- function(r) {
  ifelse(r <= 100,180,
         ifelse(r >= 100 & r < 150, 120,
                ifelse(r >= 150 & r < 200, 80,
                       ifelse(r >= 200 & r < 400, 50,
                              ifelse(r >= 400 & r < 800, 50,
                                     ifelse(r >= 800 & r < 1200, 30,
                                            ifelse(r >= 1200,0, NA)))))))
}

[![r1][1]][1]

r2 <- calc(r, fun = f)

writeRaster(r2, overwrite=TRUE, 'filePath/r2.tif')

r2data <- r2

r2data <- projectRasterForLeaflet(r2data, method = 'ngb')

pal_r2 <- colorBin(SAGA_pal[[1]], values(r2data), bins = c(0,10,20,30,40,50,60,70,80,90,100,115,120,150,180,200,220), na.color = "transparent", reverse=TRUE)

(ll_r2 <- leaflet() %>%
    addProviderTiles("Esri.WorldImagery") %>%
    addRasterImage(r2data, colors=pal_r2, opacity=0.5) %>%
    addLegend(pal=pal_r2, values=values(r2data), title="R2")
)


