-1

Using ArcMap 10.7

I have a raster with sinks in a terrain that I developed by processing a DEM dataset. Each sink has been delimited and turned into a polygon too, and its total volume was calculated as well.

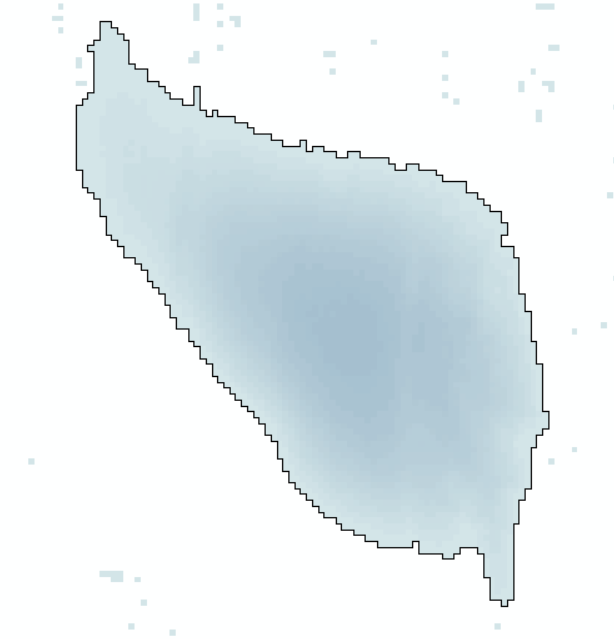
In the image below - one of this sinks and its depth values (the darker, the deeper). In black, the outline showing the equivalent polygon of the same sink.

For each sink, there is a volume of water that was calculated as the total amount of runoff that this sink receives in a given rain event. This volume of water is always smaller or equal than the total volume of the sink.

Combining the water volume and the sink's DEM, I am trying to generate a new raster file that shows the actual extent and depth of the water in those sinks that are not filled to capacity, hence transforming a raster that represents sinks' depth into a map of stillwater flooding.

It seems like this operation might be a bit complicated because each sink has an irregular surface and I have many of them - more than 18k in this case.

So far I have seen responses based on using the Cut/Fill tool to determine the volume of the sink, but this step is already solved - I know the sink's volume, and the volume of water inside of it.

I am thinking whether a progressive fill could be done starting by the deepest point of the sink, and then add small depths of water and iterate a volume calculation until I reached the modeled volume, but I am unsure about how to perform this iteration. I have seen other conversations on this matter like the one here, which focuses on the complications caused by the fill-then-spill issue, which is not a problem in this case.

6
  • 1
    If I understand you correctly, what you want to know is how much area gets flooded, after the 'sinks' get filled. So what you want is a topographical question of which elevations 'fill' for a given volume of water?
    – Mox
    Commented Dec 3, 2019 at 21:23
  • 1
    Reclass your Dem using small step, e.g. 0.5 m. Tabulate area using depressions name as column headers. Each column will represent differential elevation/ area curve convertible to elevation volume. Use indiv.volume to derive corresponding elevations.
    – FelixIP
    Commented Dec 4, 2019 at 6:51
  • @Mox Yes, thats it. It might be a matter of determining for each polygon what depth fills the desired volume. Then I could use the determined depth to fill the sink and generate a new depth raster, for each bluespot. Commented Dec 4, 2019 at 15:46
  • @FelixIP, could you please develop on how to do that? thank you. Commented Dec 4, 2019 at 15:46
  • This will require some coding efforts from you. I can post steps, but no script that I have. Is this an option?
    – FelixIP
    Commented Dec 5, 2019 at 0:18

2 Answers 2

3

Here is a link to a Python tool to loop the surface volume tool in ArcGIS. You will need a 3D Analyst license to use this tool. You will need a single raster file for each of your sinks but it looks like you already have linework that you can use to clip out each of your sinks.

The tool takes as inputs user-defined graduations above or below a given elevation (which can be out of range for your sink). The tool outputs a text file with the surface areas and volume at each graduation.

Find the volume total from the output table that matches your runoff volume. Generate a contour at that elevation.

2
  • this looks promising. If I wanted to loop this over all my sinks, I understand I should a) loop through each of the shapefile's polygons, b) isolate the raster's values that fall within that polygon, c) run the tool you shared, and d) choose the depth value that best matches the water volume for that sink. I wonder whether I will have to run the tool with very small increments? some of these sink areas are pretty large, and a small depth difference might significantly increase volume. Commented Dec 4, 2019 at 15:57
  • It looks like you have a good plan. True about the graduation values although increasing the graduations significantly increases processing time.
    – GBG
    Commented Dec 4, 2019 at 18:36
1

Reclass you elevation model using small step, e.g.

arcpy.gp.RasterCalculator_sa('Int("DEM" / 0.5)', "C:/SCRATCH/Z_CLASS")

Assign depressions good unique name, that can be used as field header in tabulate are tool:

arcpy.gp.TabulateArea_sa("Z_CLASS", "VALUE", "DEPR_RAW", "UNIQUE_ID", "C:/SCRATCH/SCRATCH.gdb/Tabulate", "1")

Derive maximum elevation of each elevation class and join result to tabulated area:

arcpy.gp.ZonalStatisticsAsTable_sa("Z_CLASS", "VALUE", "DEM", "C:/SCRATCH/SCRATCH.gdb/ZS_MAX", "DATA", "MAXIMUM")
arcpy.JoinField_management(in_data="Tabulate", in_field="VALUE", join_table="ZS_MAX", join_field="VALUE", fields="MAX")

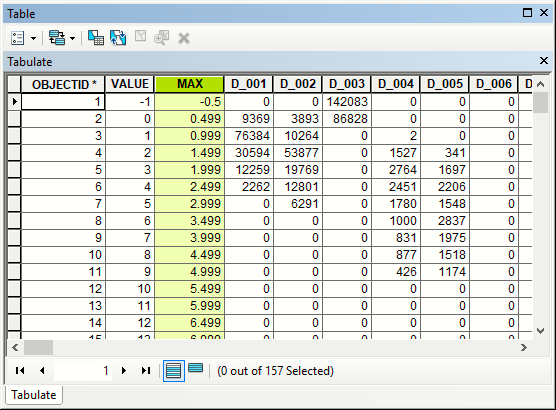
Your tabulated areas table should look like this (note I moved maximum Z forward):

enter image description here

From here it is scripting, load max.elevation into array and iterate over depressions:

  • get relevant areas column from tabulated areas
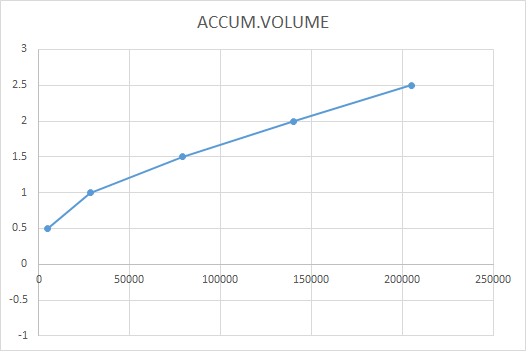
  • compute volume below individual elevation curve: enter image description here enter image description here

Interpolate elevation at given volume at that curve and store it in depressions table.

Numpy interpolate, and pandas rolling means and diff are very helpful in coding such task.

Your Answer

By clicking “Post Your Answer”, you agree to our terms of service and acknowledge you have read our privacy policy.

Not the answer you're looking for? Browse other questions tagged or ask your own question.