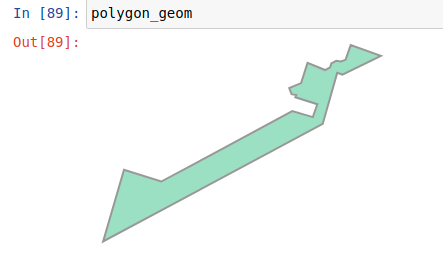
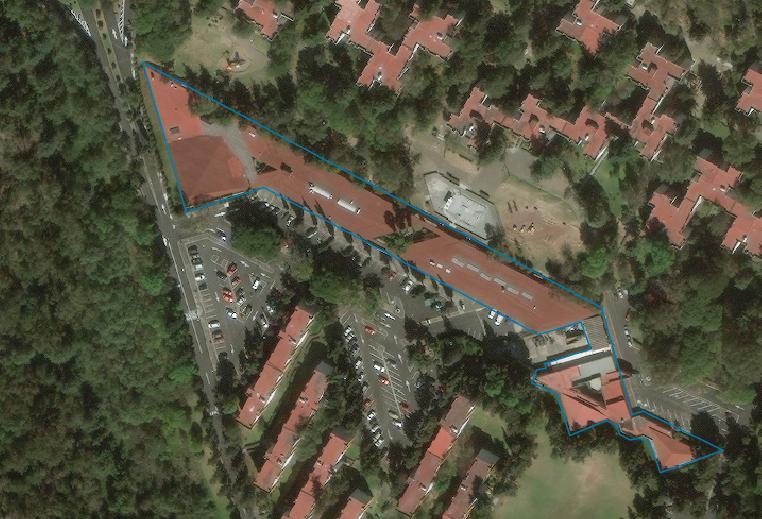
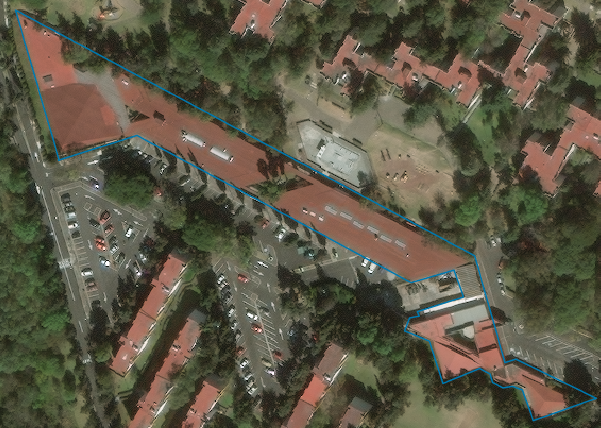
Let's look at this image, Hurricane Harvey 17. It has a big diagonally oriented bounding polygon over a stadium:
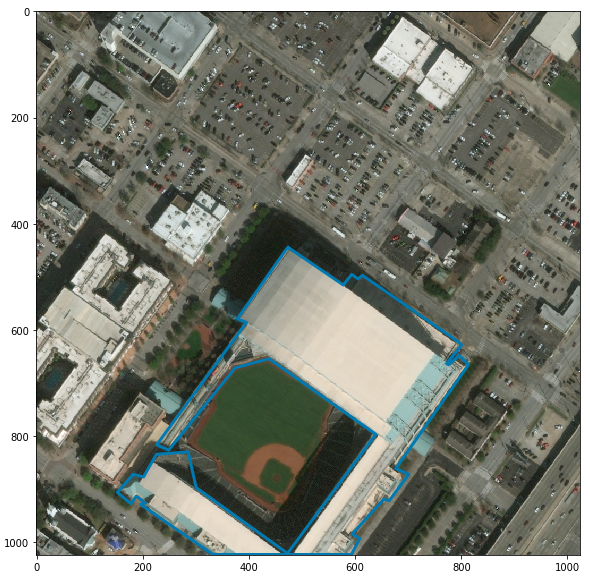
obtained as follows:
import matplotlib.pyplot as plt
import numpy as np
from PIL import Image
import shapely.wkt
import json

img_path='/home/catskills/Desktop/dataxv2/xBD/hurricane-harvey/images/hurricane-harvey_00000017_post_disaster.png'
img_path_pre=img_path.replace('_post_', '_pre_')
img_array_pre=np.array(Image.open(img_path_pre))
img_obj = Image.open(img_path)
img_array = np.array(img_obj)
label_path = img_path.replace('png', 'json').replace('images', 'labels')
label_file = open(label_path)
label_data = json.load(label_file)
plt.figure(figsize=(10,10))
plt.imshow(img_array_pre)
for feat in label_data['features']['xy']:
        try:
            damage_type = feat['properties']['subtype']
        except: # pre-disaster damage is default no-damage
            damage_type = "no-damage"
            continue
        polygon_geom= shapely.wkt.loads(feat['wkt'])
        polygon_pts = np.array(list(polygon_geom.exterior.coords))
        if feat['properties']['uid']=='529fbc55-a095-4b6a-a8f7-9cc9a93a5b44':
            plt.plot(polygon_pts[:,0], polygon_pts[:,1], linewidth=3.0)
            break
From the building mask polygon let's obtain this bitmask:
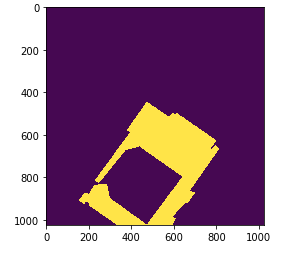
as follows:
from matplotlib.path import Path
width, height=1024, 1024
poly_path=Path(polygon_pts)
x, y = np.mgrid[:height, :width]
coors=np.hstack((x.reshape(-1, 1), y.reshape(-1,1)))
mask = poly_path.contains_points(coors).reshape(height, width).T
plt.imshow(mask);
Then let's get the image under the mask:
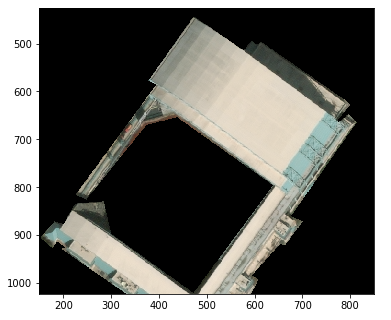
as follows:
img_masked=np.zeros(img_array_pre.shape,dtype=img_array_pre.dtype)
img_masked[mask]=img_array_pre[mask]
plt.figure(figsize=(6,6))
plt.imshow(img_masked);
plt.ylim(1023,425)
plt.xlim(150,850)
Using David Butterworth's code for minimum-area bounding rectangle, let's find the smallest rectangle enclosing the bounding polygon:
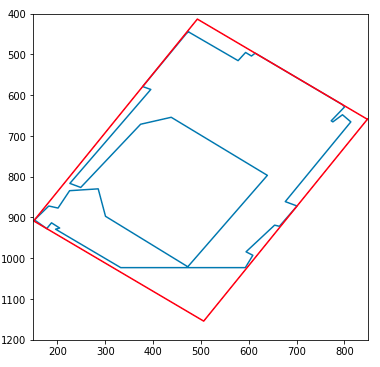
as follows:
from qhull_2d import *
from min_bounding_rect import *
xy_points=polygon_pts
hull_points = qhull2D(xy_points)
hull_points = hull_points[::-1]
(rot_angle, area, width, height, center_point, corner_points) = minBoundingRect(hull_points)
plt.figure(figsize=(6,6))
plt.plot(polygon_pts[:,0], polygon_pts[:,1])
plt.plot(corner_points[:,0], corner_points[:,1], color='red')
plt.ylim(1200,400)
plt.xlim(150,850)
Let's find a projective transformation which maps the off-axis quadrilateral bounding box to a unit square bounding box:
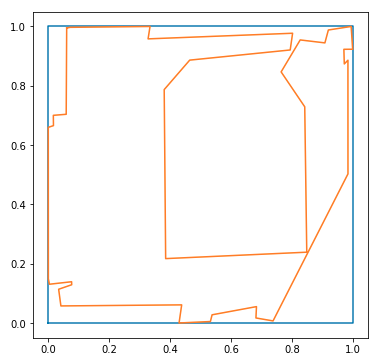
as follows:
from skimage.transform import ProjectiveTransform
t = ProjectiveTransform()
src = corner_points[0:-1]
dst = np.asarray([[0, 0], [0, 1], [1, 1], [1, 0]])
if not t.estimate(src, dst): raise Exception("estimate failed")
data_local=t(polygon_pts)
plt.figure(figsize=(6,6))
plt.plot(dst[[0,1,2,3,0], 0], dst[[0,1,2,3,0], 1], '-')
plt.plot(data_local.T[0], data_local.T[1])
Finally,run the transform in reverse from the target chip back to the source chip (which avoids creating holes in the projected image due to roundoff error on pixel locations, versus running the transform forward) as follows:
H=np.ceil(height).astype(int)
W=np.ceil(width).astype(int)
chip=np.zeros((H+1,W+1,3)).astype(img_masked.dtype)
x2, y2 = np.mgrid[:H, :W]
crds=np.hstack((x2.reshape(-1, 1), y2.reshape(-1,1))).astype(int)
crds1 = crds/np.array([H,W])
scrds=np.minimum(np.round(t.inverse(crds1)[:,::-1]).astype(int), 1023)
for i in range(scrds.shape[0]):
    (xt,yt)=crds[i]
    (xs,ys)=scrds[i]
    pixel=img_masked[xs,ys]
    chip[xt,yt]=pixel
plt.figure(figsize=(6,6))
plt.imshow(chip)
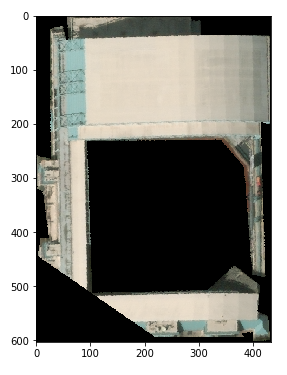
yielding finally the desired result:
