5

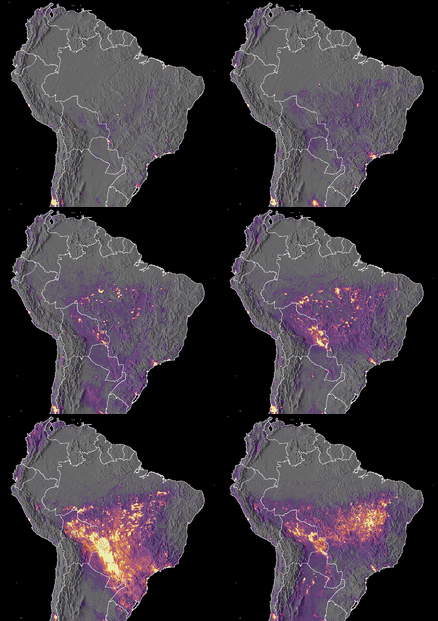
I want to make an animation of fires using MCD64A1 with a base map something similar to this Sentinel 5-P animation:

enter image description here

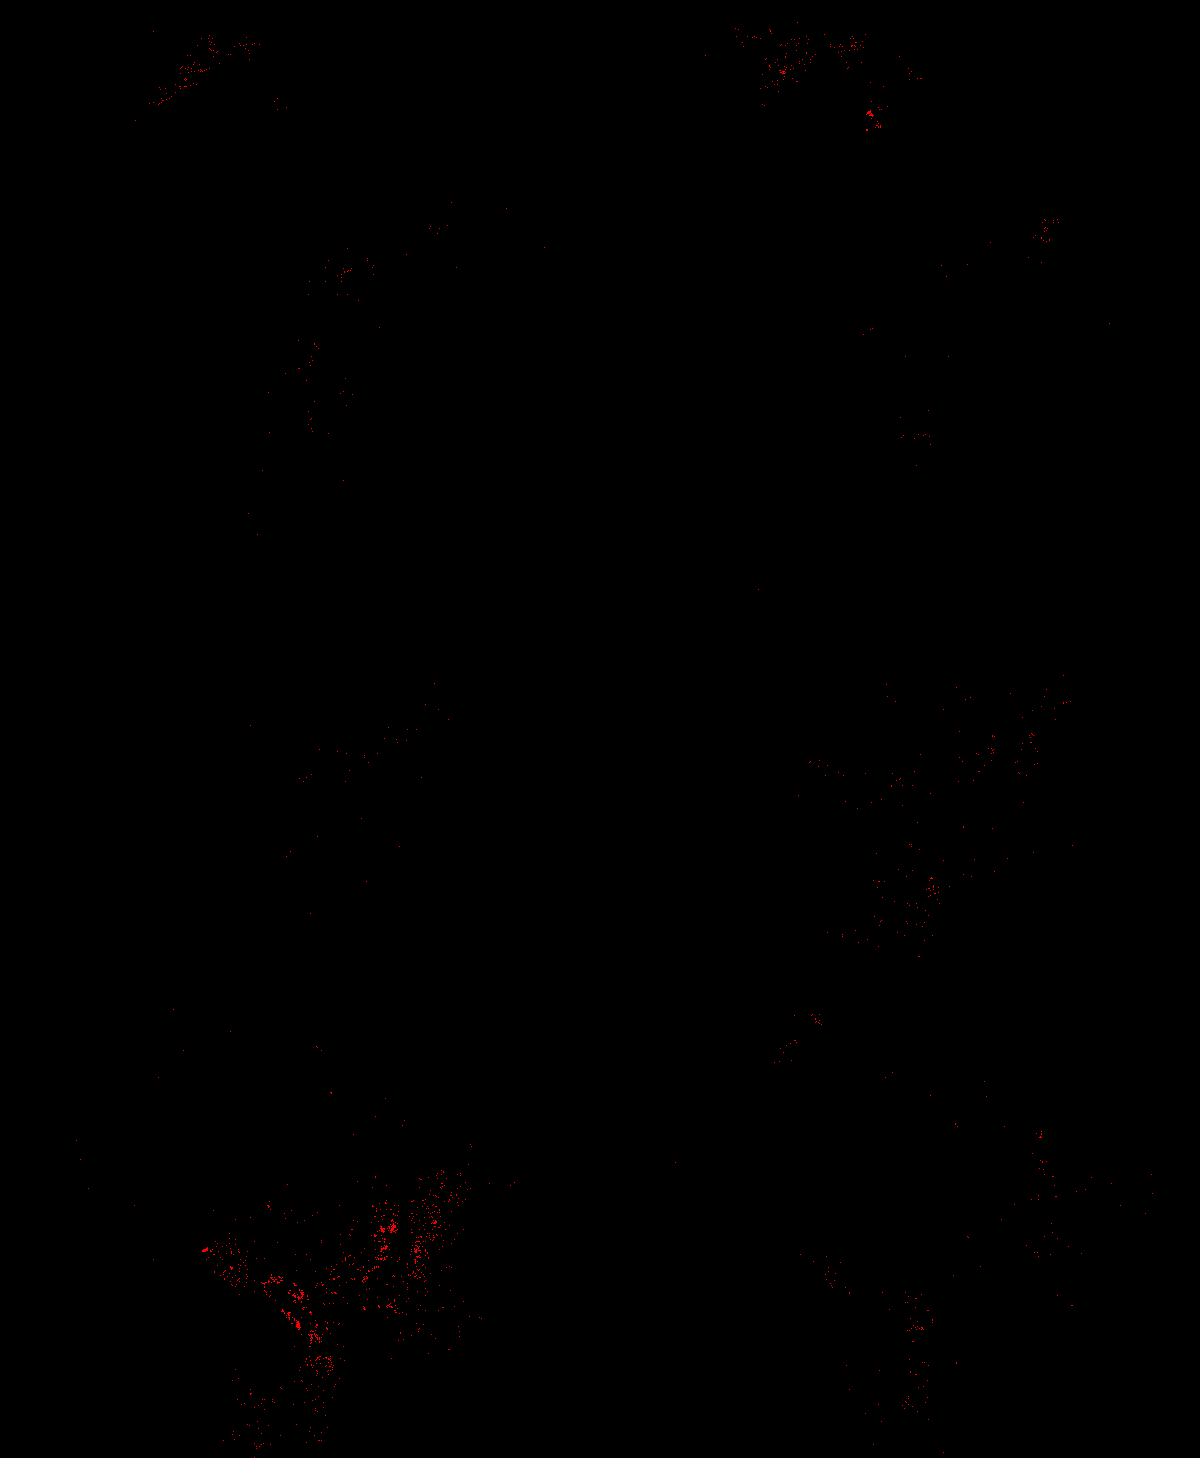
What I could make until now using this code is:

// Define a collection
var col = ee.ImageCollection('MODIS/006/MCD64A1').filterDate('2019-01-01', '2020-12-31').select('BurnDate')

// Define a mask to clip the data by.
var mask = ee.FeatureCollection('USDOS/LSIB_SIMPLE/2017')
  .filter(ee.Filter.eq('wld_rgn', 'South America'));

print(mask);

// Add outline to the Map as a layer.
Map.centerObject(mask, 3);
Map.addLayer(mask);  

// Define the regional bounds of animation frames.
var region =  
    ee.Geometry.Polygon(
        [[[-86.88829713135783, 12.937849176033298],
          [-86.88829713135783, -30.715685432081326],
          [-30.81407838135783, -30.715685432081326],
          [-30.81407838135783, 12.937849176033298]]], null, false);


print('Region', region) 

// Define RGB visualization parameters.
var visParams = {
  min: 0.0,
  max: 366,
  palette: ['FF0000']
};


// Create RGB visualization images for use as animation frames.
var rgbVis = col.map(function(img) {
  return img.visualize(visParams).clip(mask);
});

// Define GIF visualization parameters.
var gifParams = {
  'region': region,
  'dimensions': 600,
  'crs': 'EPSG:3857',
  'framesPerSecond': 5
};


// Print the GIF URL to the console.
print(rgbVis.getVideoThumbURL(gifParams));

which gives the following result:

Fires

I didn't find a way to do it.

2
  • Did you tried this? It worked? I have the same question.. Commented Jul 5, 2020 at 16:34
  • Yes the answer works!
    – Leosar
    Commented Jul 6, 2020 at 16:52

1 Answer 1

4

You'll have to add an image in the background and then display your red classified pixels on top of it. It seems like the image uses a DEM, you could for example pick the SRTM DEM in the GEE.

Play around with the visible parameters to get a nice visualization:

// define the background map variables
var srtmParams = {
  min: -13000,
  max: 15000,
  gamma: 1,
};

// Set the for south-america clipped SRTM image as background
var srtm = SRTM.clipToCollection(mask);
var srtmVis = srtm.visualize(srtmParams);
Map.addLayer(srtmVis)

Then use the blend() function to display your classified images on top of the background. Use the paint() function to display a featurecollection on top of an image.

// Create RGB visualization images for use as animation frames.
var rgbVis = col.map(function(img) {
  return srtmVis
        .paint(mask, srtmParams.max, 2) // max value will be presented in white
        .blend(img.visualize(visParams).clipToCollection(mask));
});

Link to the complete code

Your Answer

By clicking “Post Your Answer”, you agree to our terms of service and acknowledge you have read our privacy policy.

Not the answer you're looking for? Browse other questions tagged or ask your own question.