4

I am trying to give proper format to a raster (from a GEOTIFF file, previously generated). I need to show it with 3 classes, using discrete classification and equal intervals. This is easy to do from within the GUI, but I want to do it programatically. I have tried the two following approaches.

Method #1:

raster = QgsProject.instance().mapLayersByName('itp')[0]
fcn = QgsColorRampShader()
fcn.setColorRampType(QgsColorRampShader.Discrete)
lst = [ QgsColorRampShader.ColorRampItem(22.6, QColor(0,255,0)), 
QgsColorRampShader.ColorRampItem(23.2, QColor(255,255,0)),
QgsColorRampShader.ColorRampItem(100.0, QColor(255,0,0)) ]
fcn.setColorRampItemList(lst)
shader = QgsRasterShader()
shader.setRasterShaderFunction(fcn)
renderer = QgsSingleBandPseudoColorRenderer(raster.dataProvider(), 1, shader)
raster.setRenderer(renderer)
raster.triggerRepaint()
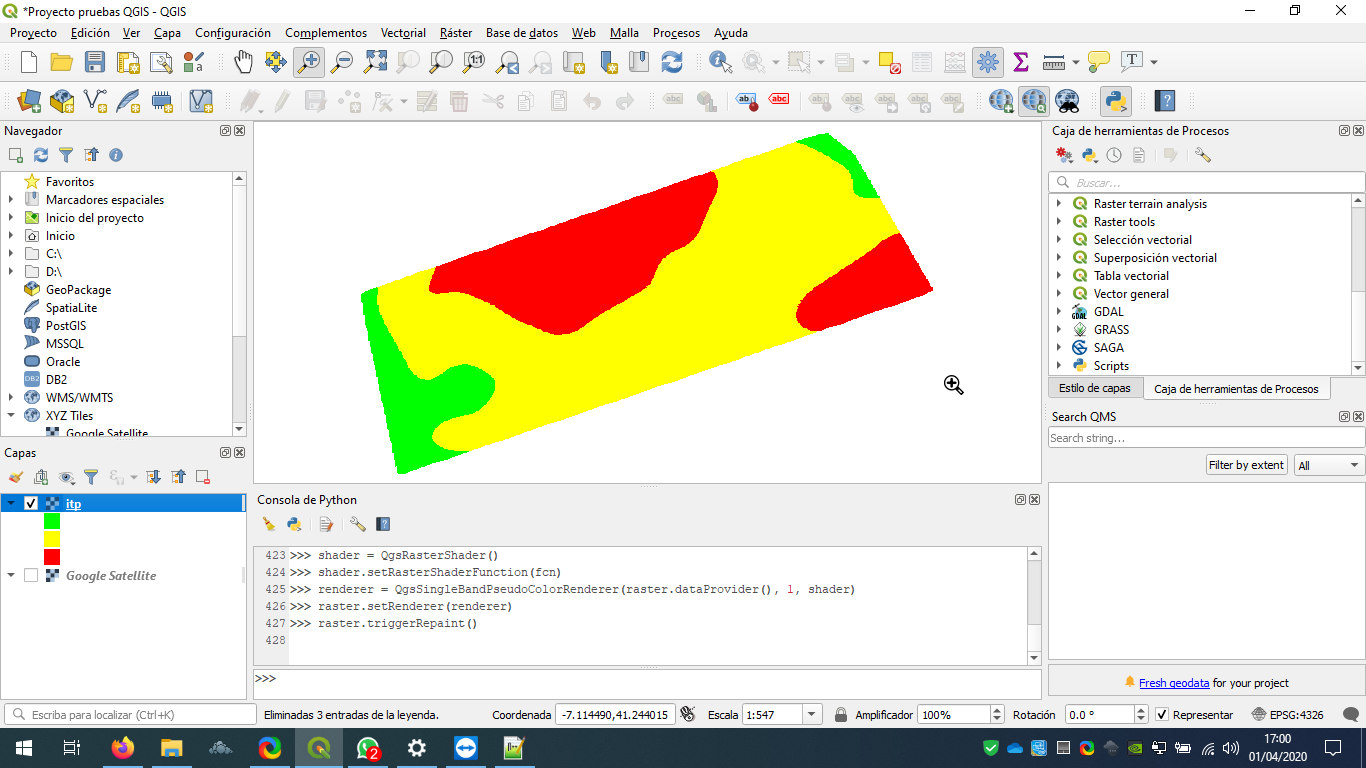
img_m1 This method works, but the labels for the groups are empty (I do not know how to fix that), and I have to manually specify the expected ranges on the ColorRampShader, which is unconvenient. So I tried the following:

Method #2:

raster = QgsProject.instance().mapLayersByName('itp')[0]
colRamp = QgsGradientColorRamp (QColor(0,255,0), QColor(255,0,0), False)
renderer = QgsSingleBandPseudoColorRenderer(raster.dataProvider(), 1)
renderer.createShader(colRamp, QgsColorRampShader.Discrete, QgsColorRampShader.EqualInterval, 3)
raster.setRenderer(renderer)
raster.triggerRepaint()

The problem is this second method does not work at all... img_m2 ...until I open the symbology properties and click accept in GUI. Calling triggerRepaint() does not help.
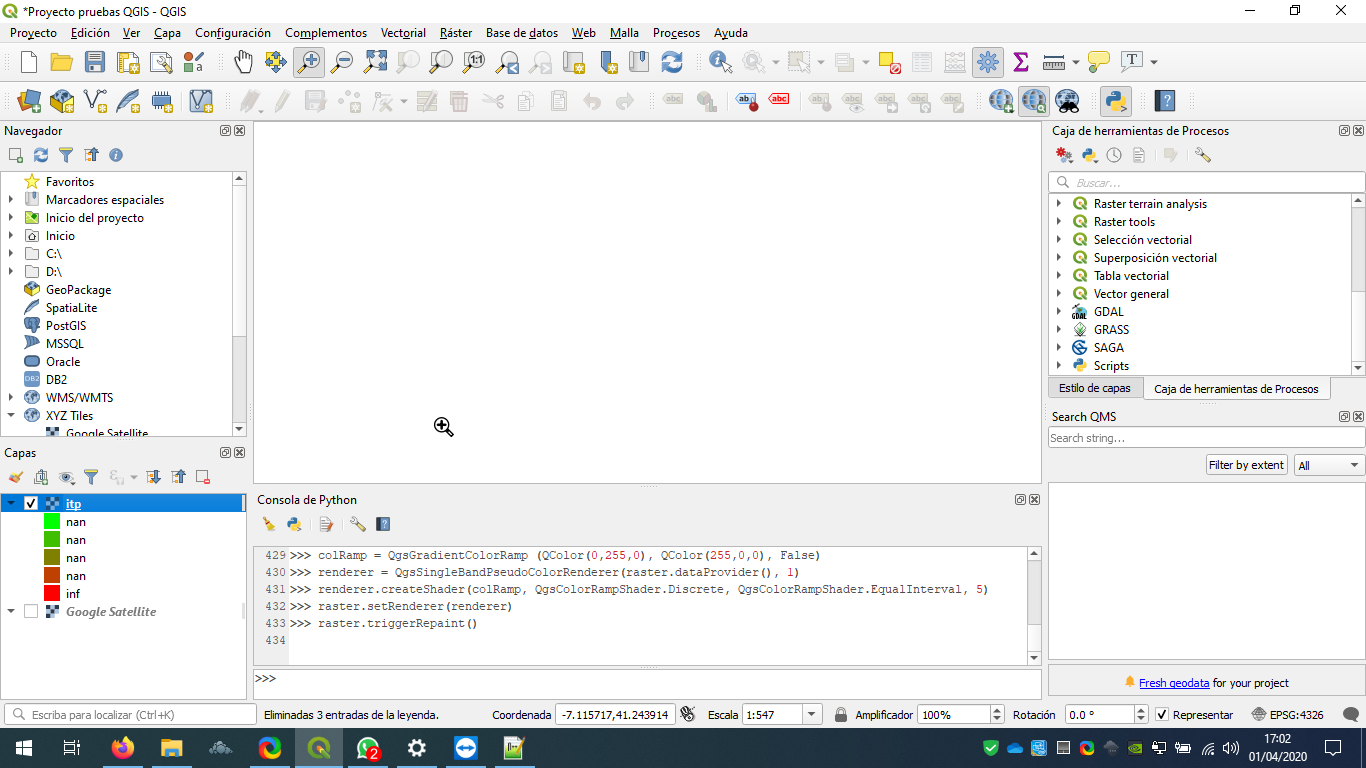
So, my question is: Why Method #2 does not work? I could not find any funcion to force refresh the calculation inside the docs, and this method does not serve my purpose if I have to manually open every output file.

And, related to this: Is there any way to specify the number of decimal/significant digits of the group labels?

1 Answer 1

4

Here is a slightly hacky (but reasonably automated) solution based on method 1 from your question. which should do something close to want you want. The key here is setting up a list of colors which is passed to the render_raster() function. The length of this list is then used as the basis for number of classes etc. I used color name strings since they are a bit easier to parse into QColor objects, but for more sophisticated color ramps etc. it wouldn't take much to modify the code slightly to use RGB or hexcodes.

This should also answer your question about labelling the classes in the table of contents and setting the decimal precision of the label values.

See in-code comments for adjusting precision of the class labels.

from osgeo import gdal


def render_raster(layer, band, spectrum):
    prov = layer.dataProvider()
    src_ds = gdal.Open(layer.source())
    src_band = src_ds.GetRasterBand(band)
    if src_band.GetMinimum() is None or src_band.GetMaximum() is None:
        src_band.ComputeStatistics(0)
    band_min = src_band.GetMinimum()
    band_max = src_band.GetMaximum()
    print(band_min, band_max)
    band_range = band_max-band_min
    class_range = band_range/len(spectrum)
#    print(class_range)
    fcn = QgsColorRampShader()
    fcn.setColorRampType(QgsColorRampShader.Discrete)
    item_list = []
    for n in range(len(spectrum)):
        band_min = band_min+class_range
#        print(band_min)
        # The line below creates color ramp items with value, color and label
        # here you can adjust precision of labels by changing 2f to e.g. 3f etc.
        list_item = QgsColorRampShader.ColorRampItem(band_min, QColor(spectrum[n]), lbl='{0:.2f}-{1:.2f}'.format(band_min-class_range, band_min))
        item_list.append(list_item)

    fcn.setColorRampItemList(item_list)
    shader = QgsRasterShader()
    shader.setRasterShaderFunction(fcn)
    renderer = QgsSingleBandPseudoColorRenderer(prov, band, shader)
    layer.setRenderer(renderer)
    layer.triggerRepaint()


rlayer = QgsProject.instance().mapLayersByName('itp')[0]
band = 1
#color_list = ['Cyan', 'Green', 'Yellow', 'Orange', 'Red']
color_list = ['Green', 'Yellow', 'Red']
render_raster(rlayer, band, color_list)

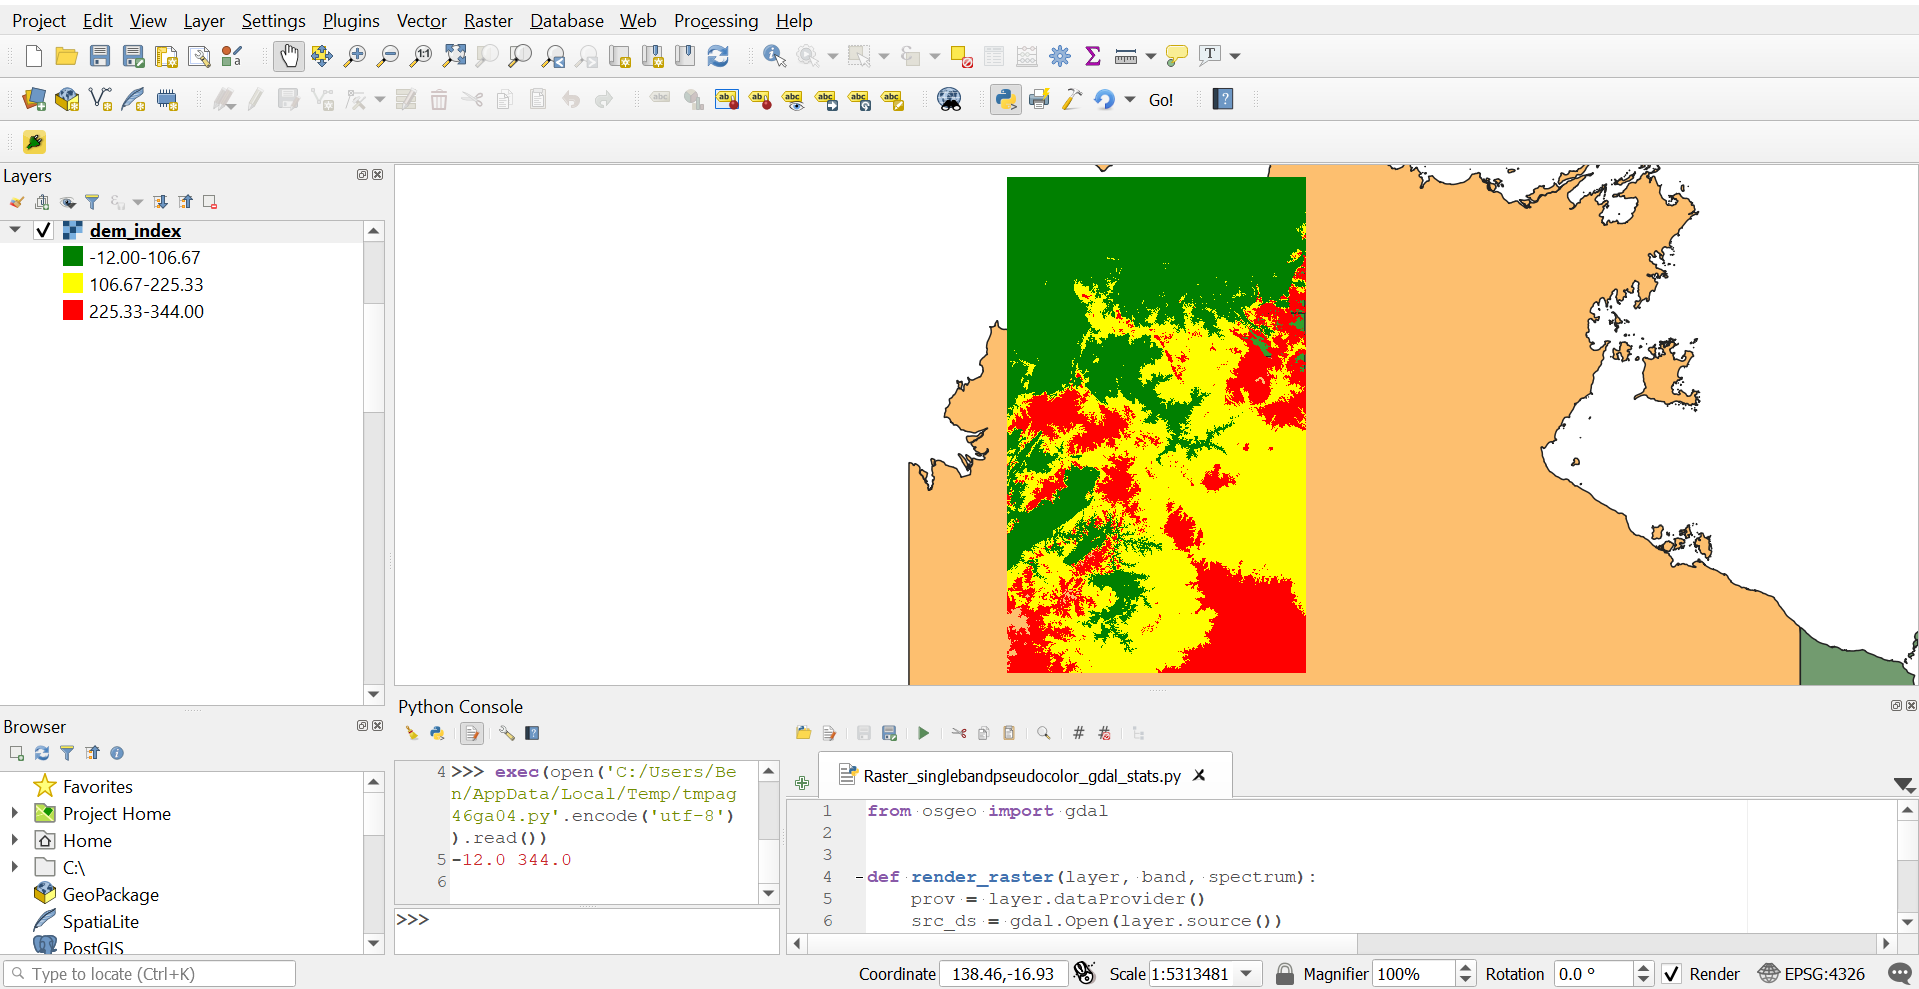
Here is the result of running the script above on a DEM:

enter image description here

3
  • Hello. Your code is very clear and answers the question flawlessly, thanks a lot. I think the part missing on my 2nd attemp was the call to ComputeStatistics(0), but I prefer your approach, since that way I have complete control over the intervals and the labels, instead of relying on QGIS to perform that task. I was neither aware ColorRampItem had an embedded attribute for the label.
    – Igb
    Commented Apr 2, 2020 at 14:33
  • Just in case someone else uses this, I found a minor bug while implementing the code, the "color_list" reference inside the function should be "spectrum", which is the name you defined for the input parameter. As color_list is global when defined in the python console, it works when called from there, but it can cause trouble when used in a script.
    – Igb
    Commented Apr 2, 2020 at 15:02
  • 1
    Hi @lgb, thanks for pointing out that bug- I moved the logic to a function after I got it working and I missed that reference. I have edited my answer and corrected the code.
    – Ben W
    Commented Apr 3, 2020 at 4:14

Your Answer

By clicking “Post Your Answer”, you agree to our terms of service and acknowledge you have read our privacy policy.

Not the answer you're looking for? Browse other questions tagged or ask your own question.