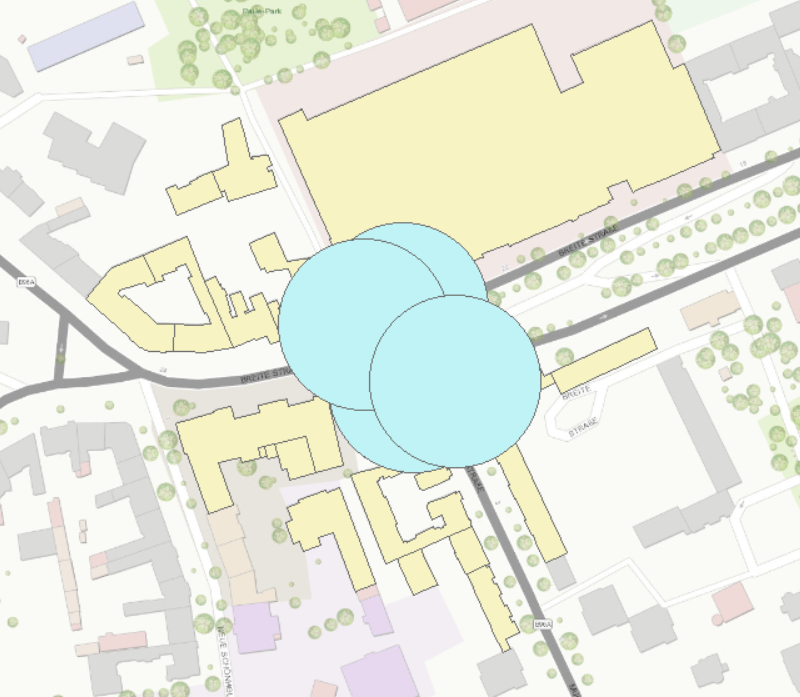
I am trying to develop a raster layer with the interference of streetlight in this example:
As you can see, there are multiple buffer rings around a point layer. I actually want to transform this buffer into raster data that behaves like an inverse square law. The border of the buffer is when the luminosity equals the background light, this constant is given. For example, 0.0708 lux.
The raster data in the buffer should behave like: L = L_0/d^2. L is the luminosity of a certain location, L_0 is the luminosity of point source and d is the distance in meters from the point source. Therefore, if the point source is 100 lux, then if you would create cellsize of 1 by 1 meter, 3 cellsizes away the cell value will be: 100/3^2 = 11.11 lux. Then the end of the raster data, namely the border of the buffer should have the cell value of 0.0708 lux, the background light lux.
But that is not all, because there are buffers that overlap each other. I actually want to sum up these overlapping values with each other. Let's say the cell value 11.11 overlaps with the other buffer raster of value 20. Then this cell value should become 31.11 lux. This value however should continue to behave like the inverse square law. This means that buffers overlapping will not be two identical perfect circles but are distorted since the intersection point would have a bigger distance before the luminosity of the cell equals the background light.
I am working in ArcMap. I do not have the skill to use a Python script for this unfortunately.

