3

I have satellite image which contains 3 different bands. I'm using Python (jupyter notebook) in order to calculate new band by applying random forest regression. My problem is that after I have predict all the values for the new pixels, I don't know how to take it back to the original dataframe with the original bands in order to create in the end new image.

This is the process I did:

  1. open the 3 bands image with rasterio, the band has this shape: (3, 869, 1202)
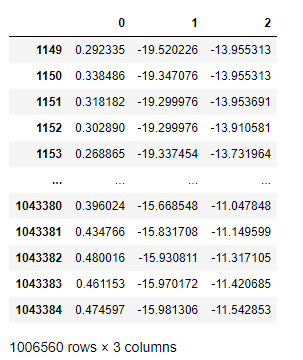
  2. create pandas df when each row represents a pixel and each column is a band :

    enter image description here

  3. train the data and fit to random forest:

    #split the data
    X_train, X_test, y_train, y_test = train_test_split(X, y, test_size=0.3, random_state=42)
    
    #import the algorithm
    rf=RandomForestRegressor()
    
    #reshape the y_train to fit the the model
    y_train=y_train.values.ravel()
    
    #fit the model
    rf.fit(X_train,y_train)
    
    rf_pred=rf.predict(X_test)
    
  4. after checking the results, apply it to the full dataset and not only to training and set in order to predict the new band:

    #create the data
    data=df.iloc[:,1:]
    
    pred_all=rf.predict(data)
    
    #reshape to one column:
    pred_all.reshape(1006560,1)
    

    So after this, I don't know how to take this predicted values back to my table or to "link" it with the original pixel entities.

My end goal is to be able in the end to have this predicted values as new band so I can create image with the new predicted values.

10
  • As I understand it, at the moment you have a two-dimensional array with values, and you want to convert it to the tiff format with a geographic reference. It's right? Commented May 28, 2020 at 6:45
  • yes, It was originally tif image, I extract it into pandas when each pixel has the three bands value, I did calculation with RF, which is seperated, and now I want to push it back into the pandas and get it back as image
    – ReutKeller
    Commented May 28, 2020 at 6:47
  • Have you read this? gis.stackexchange.com/questions/37238/… Commented May 28, 2020 at 6:54
  • Another solution: stackoverflow.com/questions/37648439/… Commented May 28, 2020 at 6:57
  • no, thank you, i'll check it out
    – ReutKeller
    Commented May 28, 2020 at 6:57

1 Answer 1

2
+100

The output will maintain the same order as it was predicted. You can use pd.concat to join it back to the original data on axis = 1.

# Re-run random forest using all the data we have available in our train set to predict accross the map area
random_forest_2 = RandomForestClassifier(n_estimators=1000, n_jobs = -1, oob_score = True)

random_forest_2.fit(Model_data_X, Model_data_Y)

#Run prediction on our apply dataset
print ('Performing prediction')
Model_apply = apply_zStats.drop('FOREST_ID', axis = 1)
Model_apply_predict = random_forest_2.predict(Model_apply)

#create dataframe
Model_apply_predict_df = pd.DataFrame(Model_apply_predict)

# Join predictions to FID and output
output = pd.DataFrame(apply_zStats['FID'])
output_merge = pd.concat([output.reset_index(drop=True), Model_apply_predict_df], axis=1)
output_merge.columns = ['FID','Class']

# Join back the training data
output_final = output_merge.append(reference_data, ignore_index = True)

Your Answer

By clicking “Post Your Answer”, you agree to our terms of service and acknowledge you have read our privacy policy.

Not the answer you're looking for? Browse other questions tagged or ask your own question.