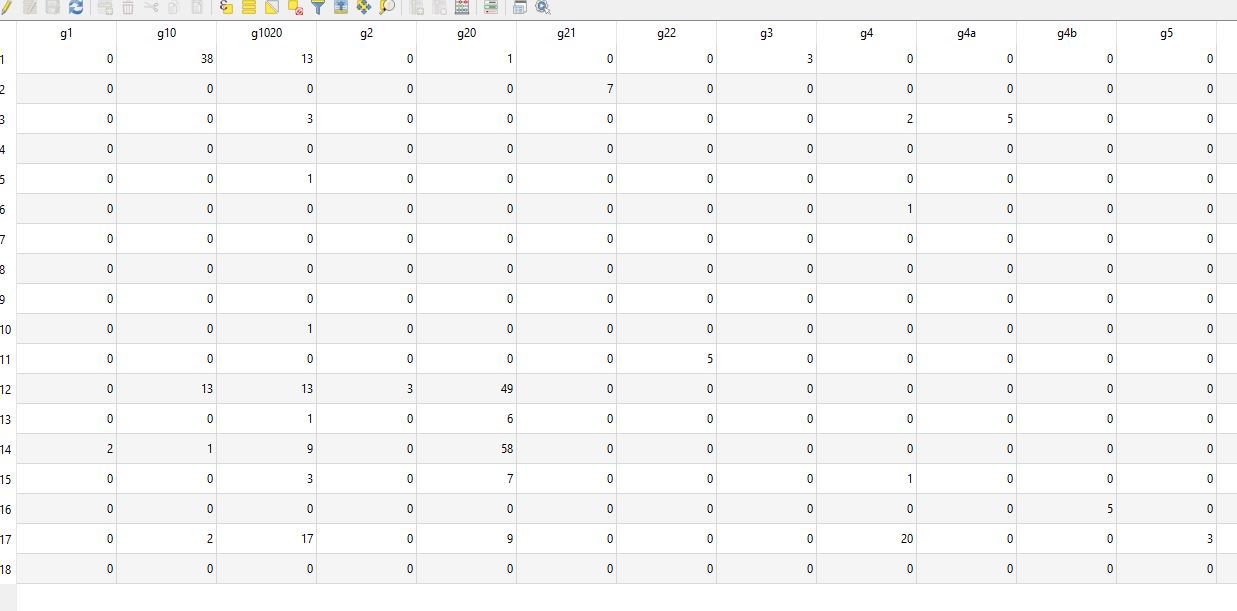
I'm working with multiple species distribution data and am looking at creating what amount to density distribution maps of those species. I have a small number of site locations (18) and only 10 species that are being tracked. Each site has the presence of from one to 10 species in values ranging from 1 - 59.
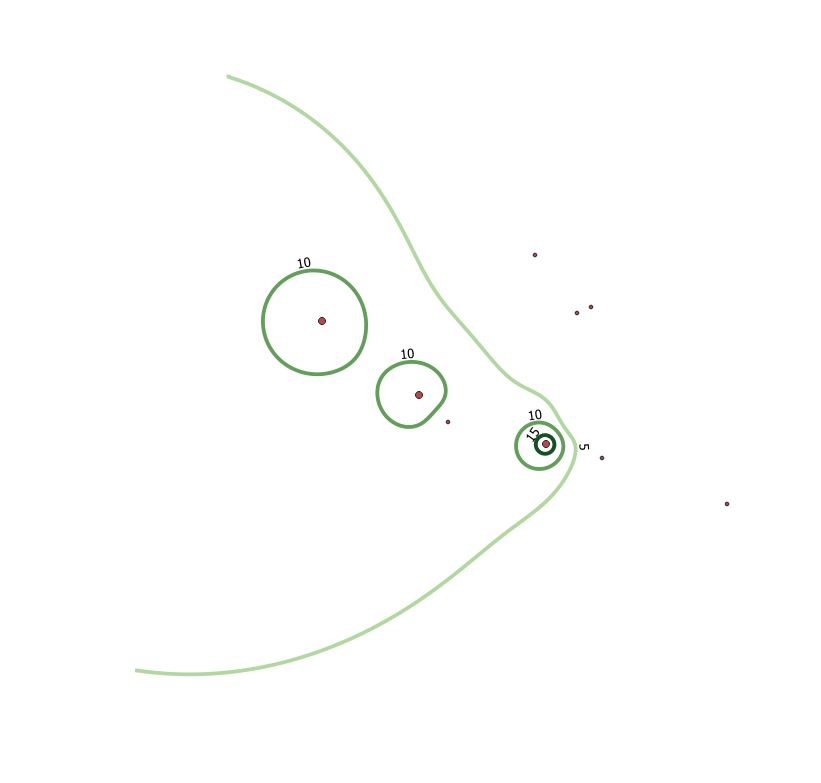
I want to create a layer that shows the density distribution of all of the species at the same time. Heatmaps in QGIS only do point density (is my understanding at least, maybe I'm wrong) and this can be weighted by an attribute, but isn't very accurate. I've done an IDW interpolation and then created contour lines, but the IDW algorithm looses the data from the low value sites and then creating contours excludes the low value sites (i.e. sites with just 1 of the species) as the values are not evenly distributed. See below.
Maybe I'm overcomplicating this, but is there a way to show the distribution of point attribute values that is more accurate and doesn't involve an interpolation that essentially erases the lower values?


