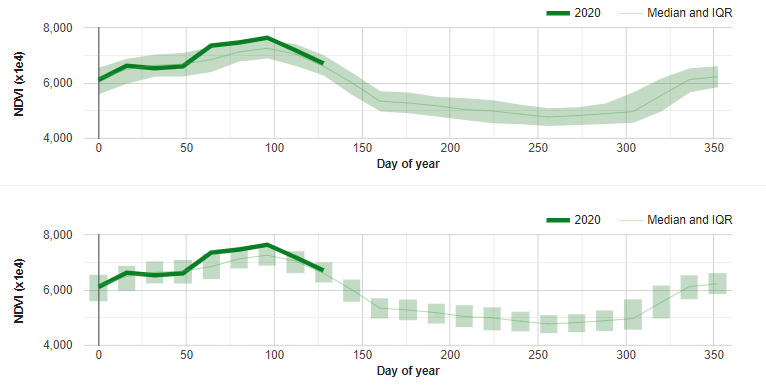
Google Charts can render interval charts; to take advantage of it in Earth Engine, you need to construct a custom data table and provide it as input to the generic ui.Chart function and set interval chart options. I've added an example of an area (envelope) interval and box interval to the question code:
Code Editor script
/**
* @license
* Copyright 2020 Google LLC.
* SPDX-License-Identifier: Apache-2.0
*/
// Define area of interest and display on map.
var aoi = ee.Geometry.Polygon(
        [[[-122.10333508394413, 36.980921854180906],
          [-122.10333508394413, 36.962269988961935],
          [-122.06179303072147, 36.962269988961935],
          [-122.06179303072147, 36.980921854180906]]], null, false);

Map.centerObject(aoi, 13);
Map.addLayer(aoi, {color: 'white'}, 'AOI');
Map.setOptions('SATELLITE');

// Load MODIS vegetation index data and subset a decade of NDVI images.
var band = 'NDVI';
var ndviCol = ee.ImageCollection('MODIS/006/MOD13A1')
                  .filter(ee.Filter.date('2010-01-01', '2020-07-01'))
                  .select(band);

// Plot NDVI as an annual time series, year over year; emphasize 2020 with a
// thicker, darker line.
print(ui.Chart.image
          .doySeriesByYear({
            imageCollection: ndviCol,
            bandName: band,
            region: aoi,
            regionReducer: ee.Reducer.mean(),
            scale: 500,
            sameDayReducer: ee.Reducer.mean()
          })
          .setOptions({
            hAxis: {
              title: 'Day of year',
              titleTextStyle: {italic: false, bold: true}
            },
            vAxis: {
              title: 'NDVI (x1e4)',
              titleTextStyle: {italic: false, bold: true},
              viewWindow: {min: 4000, max: 8000},
              baseline: 0
            },
            lineWidth: 0.5,
            colors: ['#4caf50'],
            series: {10: {lineWidth: 5, color: '#087f23'}},
            legend: {position: 'none'},
          }));
// Plot current year NDVI in the context of interannual variance.
// To do this, build two feature collections: one to hold median and
// interquartile range (IQR), and one to hold current year observations, then
// construct a data table from values of the two feature collections.
// Add a day of year (DOY) property to each NDVI image.
ndviCol = ndviCol.map(function(img) {
return img.set('doy', img.date().getRelative('day', 'year'));
});
// Define a distinct DOY collection for joining all matching images by DOY.
var distinctDoy = ndviCol.filterDate('2010-01-01', '2011-01-01');
// Perform a join between the distinct DOY collection and the entire collection.
// Include DOY matches in a property called 'doy_matches_iqr'.
var joinByDoy = ee.Filter.equals({leftField: 'doy', rightField: 'doy'});
var doyMatchesIqr = ee.ImageCollection(
ee.Join.saveAll('doy_matches_iqr').apply(distinctDoy, ndviCol, joinByDoy));
// Calculate the interquartile range and median among interannual, same-day
// observations.
var iqrIc = ee.ImageCollection(doyMatchesIqr.map(function(img) {
var doyCol = ee.ImageCollection.fromImages(img.get('doy_matches_iqr'));
return doyCol
.reduce(ee.Reducer.percentile([25, 50, 75], ['p25', 'p50', 'p75']))
.set({'doy': img.get('doy')});
}));
// Reduce the IQR image bands by a region of interest and return the results
// as properties of a feature collection.
var iqrFc = iqrIc.map(function(img) {
var stats = ee.Dictionary(img.reduceRegion(
{reducer: ee.Reducer.mean(), geometry: aoi, scale: 500}));
return ee.Feature(null, {
doy: img.get('doy'),
p25: stats.get(band + '_p25'),
p50: stats.get(band + '_p50'),
p75: stats.get(band + '_p75'),
});
});
// The IQR feature collection is complete, now work on the current year
// feature collection. The current year does not have a complete set of
// observations, missing observations need to be set to null. To do this,
// composite masked images representing all observations with the existing
// current year observations. First, make a copy of the distinct year collection
// where each image is completely masked out.
var distinctDoyMasked = distinctDoy.map(function(img) {
return img.multiply(0).selfMask().set('doy', img.get('doy'));
});
// Filter the entire NDVI collection to the current year.
var currentYear =
ndviCol
.filterDate('2020-01-01', '2021-01-01')
// Merge the current year with the masked distinct DOY collection to
// ensure the full set of annual observations (DOY) are represented
// within the collection.
.merge(distinctDoyMasked);
// Perform a join between the masked distinct DOY collection and the current
// year collection. Include DOY matches in a property called
// 'doy_matches_current'.
var doyMatchesCurrent =
ee.ImageCollection(ee.Join.saveAll('doy_matches_current')
.apply(distinctDoyMasked, currentYear, joinByDoy));
// Create a mosiac by DOY, DOYs not yet observed in current year will be
// represented by masked (null) values.
var currentIc = ee.ImageCollection(doyMatchesCurrent.map(function(img) {
var doyCol = ee.ImageCollection.fromImages(
img.get('doy_matches_current'));
return doyCol.reduce(ee.Reducer.firstNonNull()).set({
'doy': img.get('doy')
});
}))
.sort('doy');
// Reduce the current year NDVI images by a region of interest and return the
// results as properties of a feature collection.
var currentFc =
currentIc
.map(function(img) {
var stats = ee.Dictionary(img.reduceRegion(
{reducer: ee.Reducer.mean(), geometry: aoi, scale: 500}));
return ee.Feature(
null, {doy: img.get('doy'), current: stats.get(band + '_first')});
})
.sort('doy');
// Combine the current year and IQR data per DOY into a new feature collection.
var tableRowsFc = currentFc.map(function(feature) {
var doy = feature.get('doy');
var thisIqr = iqrFc.filter(ee.Filter.eq('doy', doy)).first();
var tableRow = [
doy, feature.get('current'), thisIqr.get('p50'), thisIqr.get('p25'),
thisIqr.get('p75')
];
return ee.Feature(null, {table_row: tableRow});
});
// Convert the combined feature collection to a list of lists.
var dataTable = tableRowsFc.aggregate_array('table_row');
// Define a row of column names to prepend to the data table.
var colNames = ee.List([[
{label: 'Day of year'}, {label: '2020'}, {label: 'Median and IQR'},
{id: 'p25', role: 'interval'}, {id: 'p75', role: 'interval'}
]]);
// Prepend the column names to the data table.
dataTable = colNames.cat(dataTable);
// Get the data table client-side and use it to create variance charts.
dataTable.evaluate(function(dataTable) {
// Create and display a variance envelope chart.
var envelopeChart =
ui.Chart({dataTable: dataTable, chartType: 'LineChart'}).setOptions({
intervals: {'style': 'area'},
hAxis:
{title: 'Day of year', titleTextStyle: {italic: false, bold: true}},
vAxis:
{title: 'NDVI (x1e4)', titleTextStyle: {italic: false, bold: true}},
series: {
0: {color: '#087f23', lineWidth: 5},
1: {color: '#4caf50', lineWidth: 0.5}
}
});
print(envelopeChart);
// Create and display a variance box chart.
var boxChart =
ui.Chart({dataTable: dataTable, chartType: 'LineChart'}).setOptions({
intervals: {barWidth: 1, boxWidth: 1, lineWidth: 0, style: 'boxes'},
hAxis:
{title: 'Day of year', titleTextStyle: {italic: false, bold: true}},
vAxis:
{title: 'NDVI (x1e4)', titleTextStyle: {italic: false, bold: true}},
series: {
0: {color: '#087f23', lineWidth: 5},
1: {color: '#4caf50', lineWidth: 0.5}
}
});
print(boxChart);
});


