I have tried using the below in my initial query, and query right before drawing my polygons with class breaks.
query.orderByFields = ["Shape__Area DESC"];
However this did not seem to do anything. I have also tried using grid_value field as well.
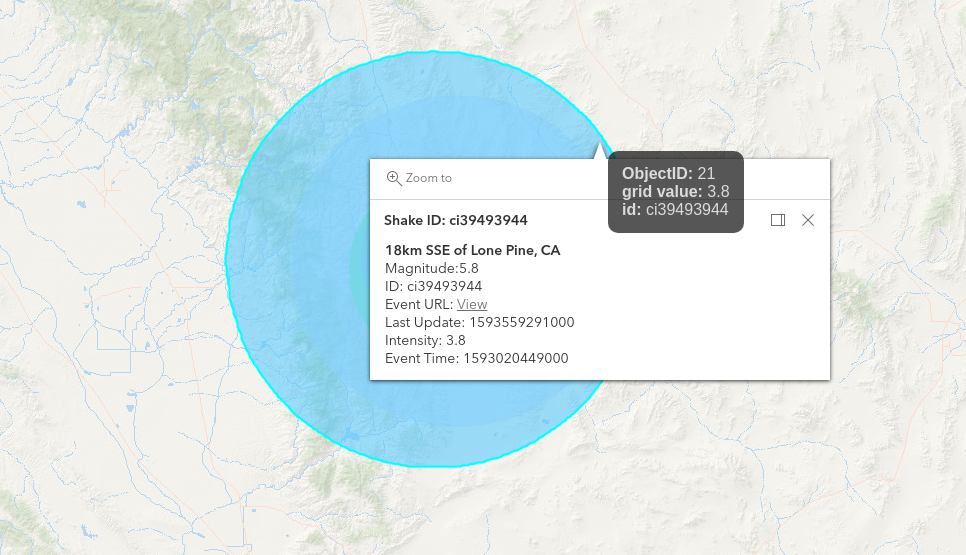
Here is my relevant code in which I am querying and then doing the drawing... main problem is occasionally large polygons block out smaller ones.. I can mostly see them, but visibility is not the issue.. I need to be able to click them as well.. if the smaller polygons would draw on top most layer, or even higher grid values on top should solve it. I found orderByFields in the docs but doesn't seem to do anything at all...
query.outFields = ["*"];
  //query.orderByFields = ["Shape__Area DESC"];
  query.returnDistinctValues = false;
  query.returnGeometry = true;
  QT.execute(query).then(function (evt) {
    evt.features.forEach(function (feature) {
      var att = feature.attributes
      var test = geometryEngine.convexHull(feature.geometry)
      var genpoly = null
      if (att.grid_value <= 4.0) {
        var rad = att.Shape__Length / 75
        genpoly = new Circle({
          center: test.centroid,
          radius: rad,
          radiusUnit: "meters"
        })
      } else {
        genpoly = test
      }
      var polygonGraphic = new Graphic({
        geometry: genpoly,
        attributes: att,
        type: "polygon"
      });
      gras.push(polygonGraphic);
    });
    var renderer = {
      type: "class-breaks",
      field: "grid_value",
      classificationMethod: "esriClassifyManual",
      classBreakInfos: [{
          minValue: 0,
          maxValue: 1.9999,
          symbol: {
            color: [0, 0, 0, 0],
            outline: {
              color: [0, 0, 0, 0],
              width: 0.4,
              type: "simple-line",
              style: "solid"
            },
            type: "simple-fill",
            style: "solid"
          },
          label: "I (Not Felt)"
        },
        {
          minValue: 2.0,
          maxValue: 3.0,
          symbol: {
            color: [191, 204, 255, .3],
            outline: {
              color: [0, 0, 0, 0],
              width: 0.4,
              type: "simple-line",
              style: "solid"
            },
            type: "simple-fill",
            style: "solid"
          },
          label: "II (Weak)"
        },
        {
          minValue: 3.1,
          maxValue: 3.9,
          symbol: {
            color: [153, 153, 255, .4],
            outline: {
              color: [0, 0, 0, 0],
              width: 0.4,
              type: "simple-line",
              style: "solid"
            },
            type: "simple-fill",
            style: "solid"
          },
          label: "III (Weak)"
        },
        {
          minValue: 4.0,
          maxValue: 4.5,
          symbol: {
            color: [136, 255, 255, 1],
            outline: {
              color: [0, 0, 0, 0],
              width: 0.4,
              type: "simple-line",
              style: "solid"
            },
            type: "simple-fill",
            style: "solid"
          },
          label: "IV (Light)"
        },
        {
          minValue: 4.5,
          maxValue: 4.9999,
          symbol: {
            color: [125, 248, 148, 1],
            outline: {
              color: [0, 0, 0, 0],
              width: 0.4,
              type: "simple-line",
              style: "solid"
            },
            type: "simple-fill",
            style: "solid"
          },
          label: "V (Light)"
        },
        {
          minValue: 6.0,
          maxValue: 6.9999,
          symbol: {
            color: [255, 255, 0, 1],
            outline: {
              color: [0, 0, 0, 0],
              width: 0.4,
              type: "simple-line",
              style: "solid"
            },
            type: "simple-fill",
            style: "solid"
          },
          label: "VI (Strong)"
        },
        {
          minValue: 7.0,
          maxValue: 7.9999,
          symbol: {
            color: [255, 221, 0, 1],
            outline: {
              color: [0, 0, 0, 0],
              width: 0.4,
              type: "simple-line",
              style: "solid"
            },
            type: "simple-fill",
            style: "solid"
          },
          label: "VII (Very Strong)"
        },
        {
          minValue: 8.0,
          maxValue: 8.9999,
          symbol: {
            color: [255, 145, 0, 1],
            outline: {
              color: [0, 0, 0, 0],
              width: 0.4,
              type: "simple-line",
              style: "solid"
            },
            type: "simple-fill",
            style: "solid"
          },
          label: "VIII (Severe) "
        },
        {
          minValue: 9.0,
          maxValue: 9.9999,
          symbol: {
            color: [255, 0, 0, 1],
            outline: {
              color: [0, 0, 0, 0],
              width: 0.4,
              type: "simple-line",
              style: "solid"
            },
            type: "simple-fill",
            style: "solid"
          },
          label: "IX (Violent)"
        },
        {
          minValue: 10.0,
          maxValue: 10.9999,
          symbol: {
            color: [221, 0, 0, 1],
            outline: {
              color: [0, 0, 0, 0],
              width: 0.4,
              type: "simple-line",
              style: "solid"
            },
            type: "simple-fill",
            style: "solid"
          },
          label: "X"
        },
        {
          minValue: 11.0,
          maxValue: 11.9999,
          symbol: {
            color: [136, 0, 0, 1],
            outline: {
              color: [0, 0, 0, 0],
              width: 0.4,
              type: "simple-line",
              style: "solid"
            },
            type: "simple-fill",
            style: "solid"
          },
          label: "XI"
        },
        {
          minValue: 12.0,
          maxValue: 12.0,
          symbol: {
            color: [68, 0, 0, 1],
            outline: {
              color: [0, 0, 0, 0],
              width: 0.4,
              type: "simple-line",
              style: "solid"
            },
            type: "simple-fill",
            style: "solid"
          },
          label: "XII"
        }
      ]
    }
         var popupTrails = {
             outFields: ["*"],
             "title": "Shake ID: {id}",
            "content": function (feature){
              let name_plc;
              let dlv = document.createElement("div");
              dlv.className = "popd";
              dlv.innerHTML = `<b><span class='name_plc'></span></b><br>ID: <span class="ida">${feature.graphic.attributes.id}</span><br> URL: <a href="${feature.graphic.attributes.url}" target="_blank">View</a> <br> Updated: ${feature.graphic.attributes.updated} <br>Grid_value: ${feature.graphic.attributes.grid_value}<br> Event Time: ${feature.graphic.attributes.eventTime} <style>.esri-popup__navigation { display: none;}</style>`;

              getName();

              function getName() {
               let cId = $('span.ida').text();
               if (cId) {
                  //console.log(cId);
                  let q3 = new Query();
                  q3.where = "id = '"+ cId +"'";
                  q3.outFields = ["*"];
                   QTt.execute(q3).then(function (results) {
                      results.features.map(function (feat) {
                        let pID = feat.attributes["id"];
                        if (cId === pID) {
                           name_plc = feat.attributes["place"];
                             console.log(name_plc);
                             let tx = $('.name_plc').text();
                             if (tx == 0){
                               $(".name_plc").append(name_plc);
                             }
                        }
                      });
                  });
              } else {
                setTimeout(getName, 230);
              }
             }
              return dlv;
      },
    };
    fl = new FeatureLayer({
      source: gras,
      objectIdField: "ObjectID",
      geometryType: "polygon",
      fields: [{
        name: "ObjectID",
        alias: "ObjectID",
        type: "oid"
      }, {
        name: "id",
        alias: "id",
        type: "string"
      }, {
        name: "updated",
        alias: "Last Update",
        type: "string"
      }, {
        name: "eventTime",
        alias: "eventTime",
        type: "string"
      }, {
        name: "url",
        alias: "url",
        type: "string"
      }, {
        name: "grid_value",
        alias: "grid_value",
        type: "double"
      }],
      renderer: renderer,
      popupEnabled: true,
      //outFields: ['*'],
      popupTemplate: popupTrails,
      visibleElements: [{
          featureNavigation: false,
      }],
    });
    map.add(fl);
Here is my full CodePen as well.. Any way to do this client-side JavaScript? Simply change index to smallest polygons on top?! 1/3 times some of my polygons render in the correct order... But I need to ensure they all always do, so they are visible and I can click them.
You can see in the screenshot a 3.8 grid value polygon overlapping making the inner 6.5 and 7.8 grid_value polygons in accessible to click.

