3

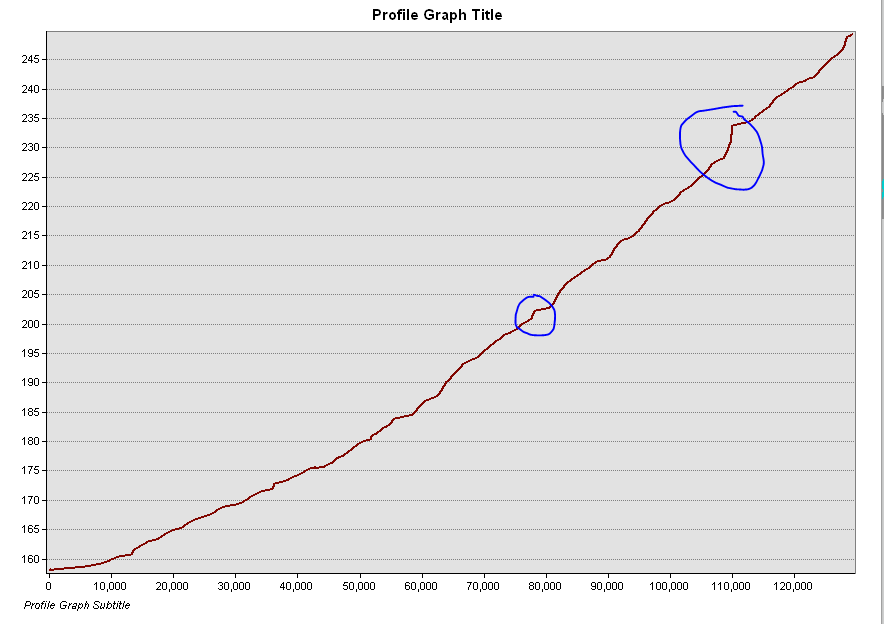
My goal is to generate points along my stream centerline at any positive inflection points (0.5 feet in elevation or greater). I used a Water Surface Grid (Raster) to convert my stream centerlines to 3D using the Interpolate Shape tool.

Looking at my stream in profile view, here are some examples of where I'd like to create points:

enter image description here

I posted a similar question before, but this script compares absolute difference between any two vertices and does not capture inflection points. Create points along 3D stream where elevation changes by 1ft

My idea is to store the starting value then look at the next vertex, if less than 0.5, skip and move onto the next vertex. Continue this till I hit a vertex that is 0.5 or greater from the starting point. Then create a point at this vertex. Then, move on and find the next jump of 0.5 or more.

Does someone have any ideas on how to script this out using ArcPy & Python 3?

4
  • You might want to define a length tolerance or slope (0.5 over the length). If not, then it is a matter of perspective. The denser the vertices the less 0.5 inflections you will have, if the vertices are very spaced out, every point will be a 0.5 inflection.
    – Rex
    Commented Oct 9, 2020 at 1:21
  • Yes, this is what I'm seeing now. My water surface grid is 10-ft cell size, so I'm actually getting no 0.5 inflections now. Can you elaborate on how to do this? Commented Oct 27, 2020 at 13:23
  • First, we are using points or vertices to define the line so we are really sampling the line. So we need to figure out a sample length that works. Second, if we are really interested 'inflection' and not the steepness of the lines (slope), then what we really want to look for is a change in slope, not a change in elevation. Because even if we find the right sample length, we may get several consecutive segments that increase 0.5 ft, but there would be no inflection (except the first) on your profile.
    – Rex
    Commented Oct 28, 2020 at 14:48
  • Thanks - good points that got me thinking. This segment was just one example, I will be working with several thousand stream segments so it's nearly impossible to determine a sample length to split by that works for each stream. I posted another questions about using a curvature raster to tackle this problem Commented Oct 28, 2020 at 15:35

3 Answers 3

4
+225

Ensure your polylineZ centerlines start at the top of your drainage and point downstream. Split your centerlines into some division lengths that are reasonable for your analysis (like the pixel resolution of your water level raster). Add the Z values from your water level raster using Add Z information. Use the add geometry to attribute table to populate the attribute table with the start and end vertex Z values of the newly created segments. Subtract the start Z from the end Z values using calculate field. Those records that satisfy your requirement are your inflection points.

The links provided have Python code samples (or build the project in Modelbuilder and export to Python if you want).

3
  • Thanks! This works, but my water surface grid is a 10ft cell size, so my streams are split every 10ft. There isn't much variation between cells across 10ft so I hardly capture any points with a difference of 0.5ft. Do I need to increase the distance my lines are split? Commented Oct 27, 2020 at 12:18
  • In your original post, you have a 5 ft drop over what, ~2000' run circled, as an inflection point. Redo you calculations on every 2000' increment. You do not have to redo any of the data creation steps above. Just redo the subtractions on your user-defined intervals.
    – GBG
    Commented Oct 27, 2020 at 16:18
  • Note that as you increase the segment lengths, you also can wash-out the line and lose the actual inflection point.
    – Rex
    Commented Oct 28, 2020 at 14:45
1

An alternative approach is to first create a curvature raster (curvature tool is available in 3D or in Spatial analyst) then get the points where this raster exceeds a given threshold. If you have many streams this could be quite efficient.

5
  • I support this solution option, provided you perform it once, capture the python commands, parameterize the inputs, and can re-run it repeat-ably... Commented Oct 13, 2020 at 17:10
  • Thanks I think this is a good suggestion, since I'm hoping to run this process on all streams in a HUC8 watershed. I'm new to raster analysis, though. I created the curvature raster using my water surface grid. I'm thinking I can convert these to points using Raster to Point. Then select the points with a value greater than to equal to some threshold. Would you know how to determine the threshold? Commented Oct 27, 2020 at 12:14
  • I don't know a lot about the curvature tool, but it looks at the entire neighborhood of a pixel for its calculation while the question is about the values along the stream centerline.
    – Rex
    Commented Oct 28, 2020 at 15:45
  • good remark, but curvature will go along the steepest slope, and so should the stream. So it should work quite good. However, you are right in case the stream is turning with an acute angle.
    – radouxju
    Commented Oct 28, 2020 at 15:55
  • Yup - it's not quite capturing curvature along the stream centerline as I was expecting. I posted another questions that has a screenshot of the results Commented Oct 30, 2020 at 13:16
0

If you were more comfortable calculating the inflection in excel, you would only need to log the centerline ID and the measure, then use "Make Route Event Layer" to locate those points along the centerline.

Your Answer

By clicking “Post Your Answer”, you agree to our terms of service and acknowledge you have read our privacy policy.

Not the answer you're looking for? Browse other questions tagged or ask your own question.