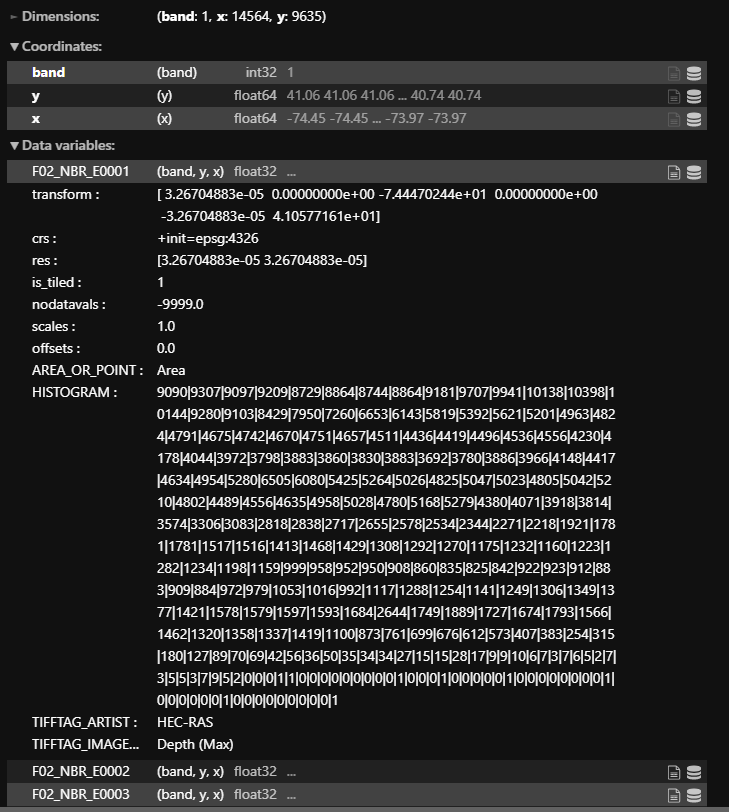
Suppose I have a rather large NetCDF file that I open as a dataset using xarray.
import xarray

nc_in = r"....\D_P_WGS84_comp.nc"
nc_ds = xarray.open_dataset(nc_in)
It is composed of multiple raster variables, each with a single band, x, y coordinates and a crs (4326):
nc_ds
Suppose I want to visualize this very simply in my Python Notebook. I don't really want to add basemaps or legends or anything like that. I tried simply running show(nc_ds) but throws an errors AttributeError: 'Dataset' object has no attribute 'shape'`. I also noticed that the dimensions are frozen. What is the simplest way to visualize this dataset or a single variable of it in Python? Is there a mod or package extension that would do this?


show(nc_ds.data_vars['F02_NBR_E0002'])work?