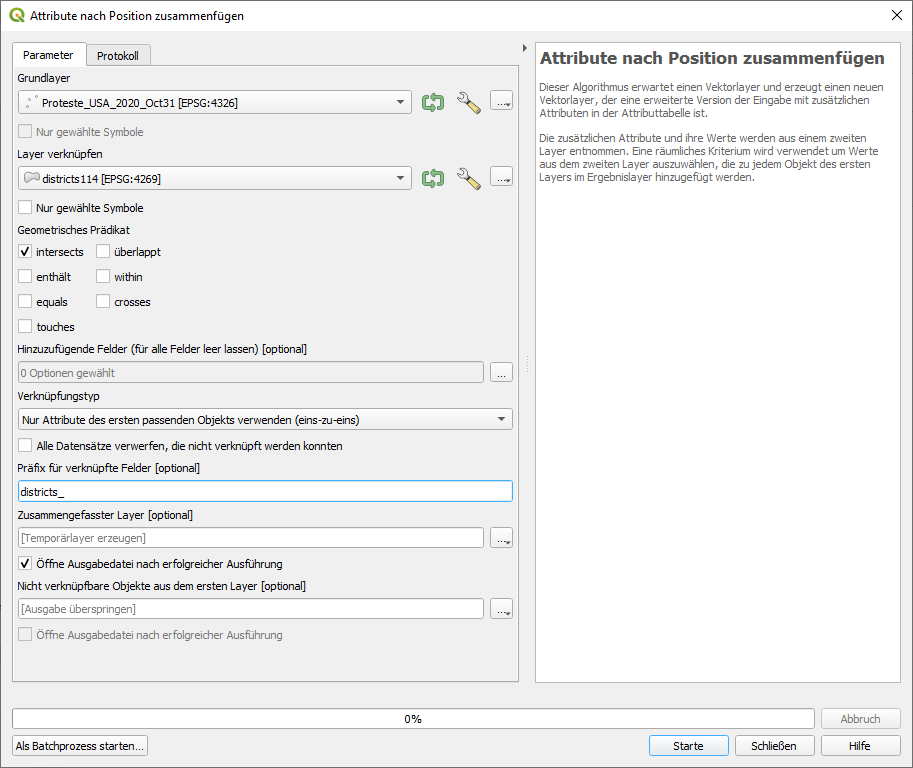
The short answer: a) both files can be in different format (one as csv, one as shapefile) b) as you can read in the description of the algorithm (in the dialogue window when you start "Join attributes to location"), it creates a new layer, based on your points (protests), adding the attributes of the district the point lies in.
See the following picture (even if its in german, it should become clear how to use).

The longer answer: there are some problems with your data (as often when downloading data, you often have to adjust it for proper use).
First, the protests are in an excel file (xlsx). To import it in QGIS, you need it as a CSV file. Open it in Excel. However, there are a lot of semicolons (;) around in the data, you have to remove them as they are also used as text-delimiter character of the csv. So before exporting your file, in Excel search and replace the semicolon with another character, like hyphen (-). Than save as... and choose csv, best use the CSV UTF-8 option.
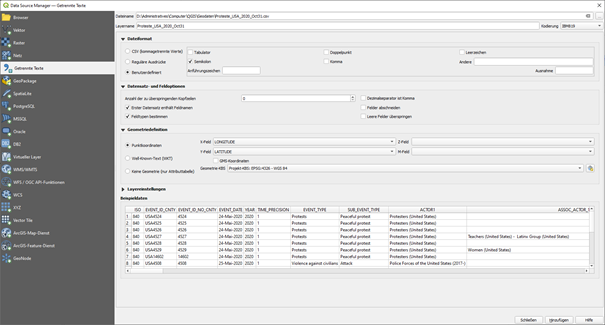
Now you can import this csv in QGIS: again, see screenshot that should illustrate the options, even if it's in german. Be sure to choose the semicolon as text delimiter and make sure the other characters are not checked. Geometry definition: point coordinates, Geometry CRS EPSG:4326, make sure the x and y-fields are correctly interpreted. Than add to your project.

Loading the shapefile with districts should not be a problem.
However, when using the "Join attributes to location", there is an error message, as there are invalid geometries. So first, you have to repair the geometries of your shapefile. Use the "repair geometries" from the processing toolbox and select your district-layer as input. The algorithm will create a new layer with the repaired geometries. Use this one for processing with "Join attributes to location".
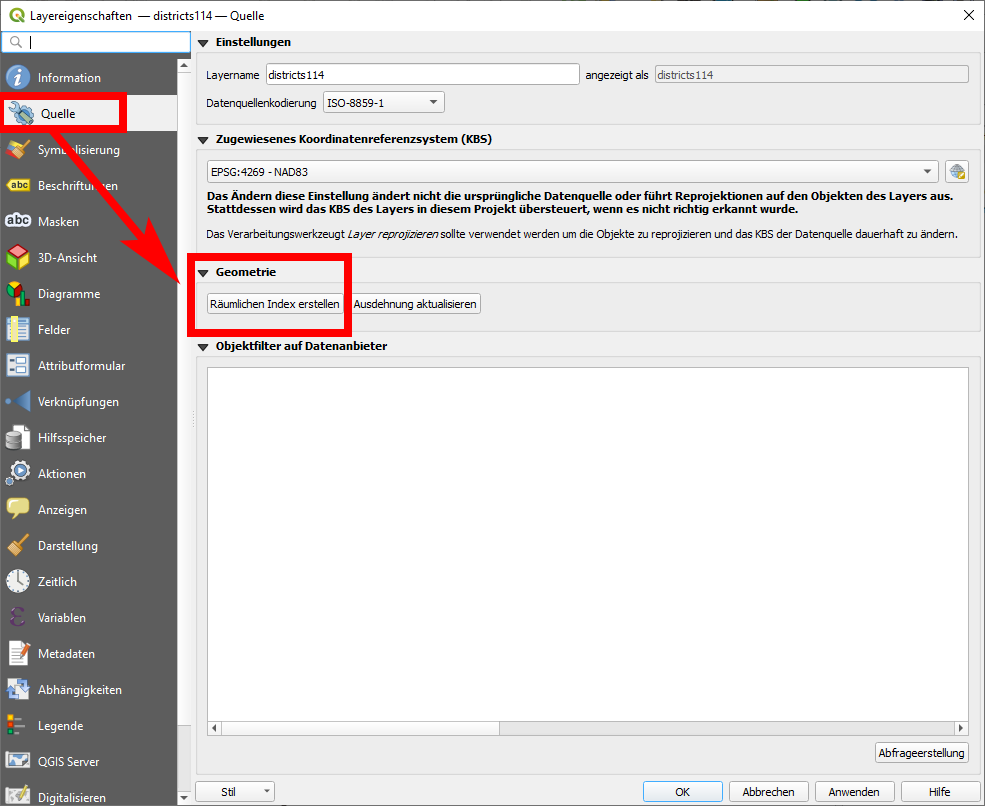
This takes quite a while, on my machine (QGIS 3.16, Win 10) it took 6:42 min. Better first create a spatial index for your vector layer: right click on the layer - properties - source tab - under the entry Geometry: create spatial index. With this, "Join attributes to location" took only 26 seconds!


join attributes by locationworks?