3

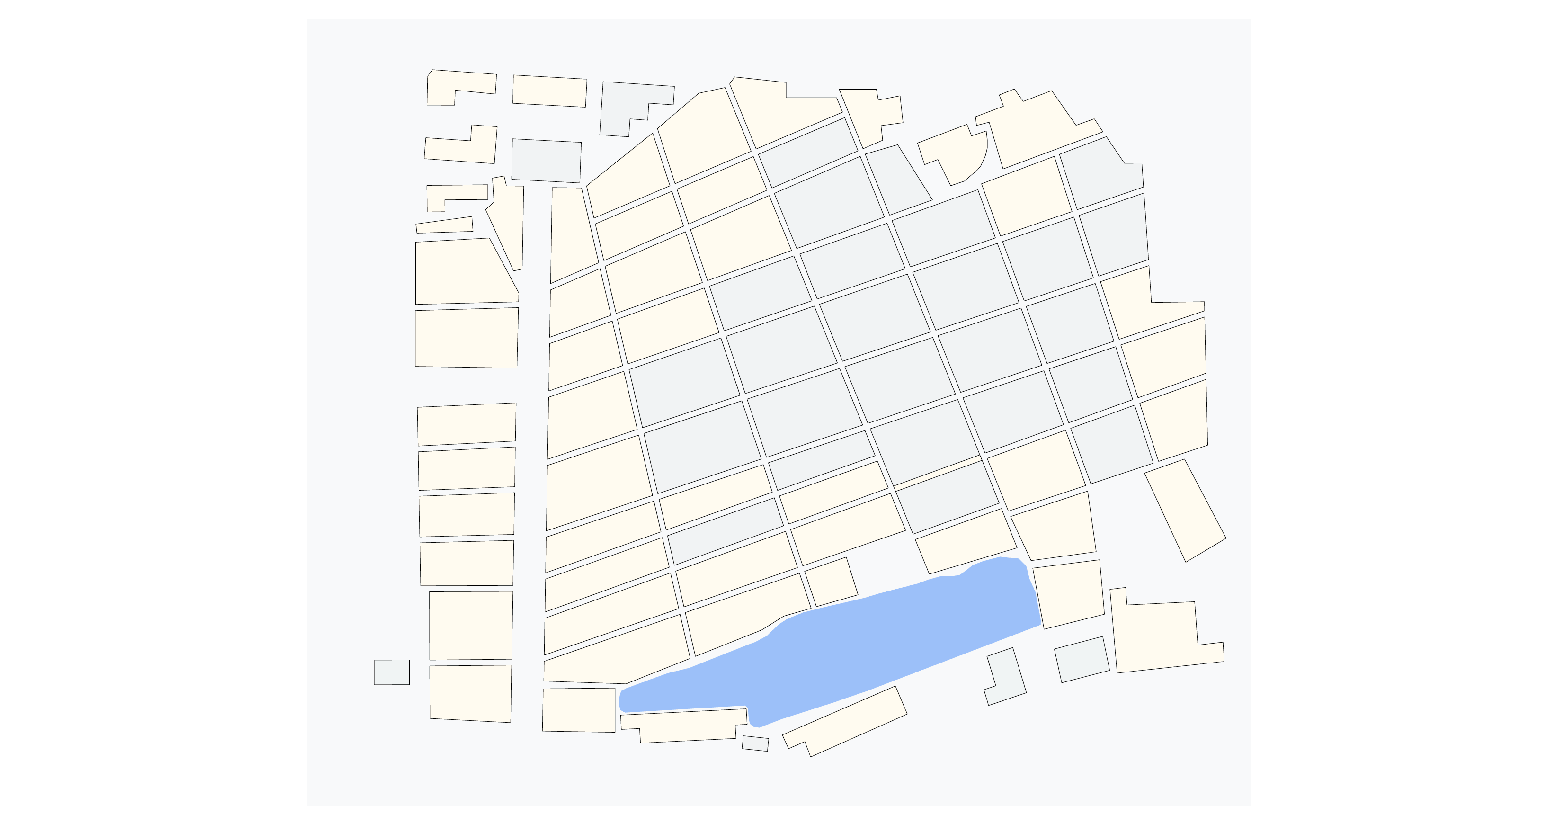
I am using the shapes interface of rasterio to extract polygons from a GeoTIFF image. rasterio returns an excessive number of polygons which is not expected. It is taking a long time to extract a relatively very simple raster. I did additional processing of the resulting shapefiles, namely Dissolve and Multipart to a single part, and eventually, get the correct polygons.

Can any experts in rasterio can shed some light on what is happening? For the sample raster, I am expecting fewer polygons whereas rasterio shapes are 77562 in number. File shared here

import pandas as pd
import geopandas
import matplotlib.pyplot as plt
import numpy as np
import os

import rasterio
from rasterio.features import shapes
mask = None
results=None
with rasterio.Env():
    with rasterio.open('/content/small_area.tif') as src:
        image = src.read(1) # first band
        results = (
     
        {'properties': {'raster_val': v}, 'geometry': s}
        for i, (s, v) 
        in enumerate(
            shapes(image, mask=mask, transform=src.transform)))
        
geoms=list(results)        

import geopandas as gp

gdf = geopandas.GeoDataFrame.from_features(geoms) #Convert to Geopandas dataframe

gdf.insert(0, 'New_ID', range(0, 0 + len(gdf)))

gdf.head()

gdf.set_crs(epsg=3857, inplace=True)
gdf = gdf.to_crs(epsg=3857)
gdf.set_geometry(col='geometry', inplace=True)
gdf.to_file("small_area.shp")

enter image description here

4
  • What is the size of your raster in pixels?
    – user30184
    Commented Dec 8, 2020 at 14:33
  • The one I posted here is PNG. The GoeTIFF is 9 MB. It is cropped from a bigger file @30MB
    – addcolor
    Commented Dec 9, 2020 at 4:09
  • With "in pixels" I meant the size as width x height, columns x rows.
    – user30184
    Commented Dec 9, 2020 at 6:43
  • Width=1994x Height=1662
    – addcolor
    Commented Dec 9, 2020 at 8:30

1 Answer 1

2

I am getting exactly the same number of polygons (77562) with GDAL utility gdal_polygonize.

gdal_polygonize -f gpkg small_area.tif small.gpkg

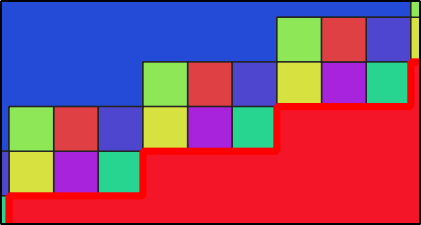
If I open the resulting vector layer with QGIS and apply random color classification by the DN field that contains the pixel values from the source raster it is easy to see why there are so many polygons in the result. This is a magnified view of the polygons and the colorful boxes are presenting a diagonal line in the source map.

enter image description here

The straight lines which look like solid black in the map are actually rendered with antialiasing and pixels have many different color values.

The rasterio.features.shapes function is documented in https://rasterio.readthedocs.io/en/latest/api/rasterio.features.html

Get shapes and values of connected regions in a dataset or array.

The antialiased colors are not connected and therefore the result contain large number of single pixel polygons.

By the screen capture it looks like that there were connected blues divided into different polygons but actually there are two different dark blue colors and they have values 32 and 241 in the data.

The function works as it is supposed to work. You can try to re-process the source map with another rasterio function rasterio.features.sieve

Replace small polygons in source with value of their largest neighbor.

Polygons are found for each set of neighboring pixels of the same value.

1
  • Very clear. I have not bothered to zoom that close. Now I understand it better.
    – addcolor
    Commented Dec 9, 2020 at 10:56

Your Answer

By clicking “Post Your Answer”, you agree to our terms of service and acknowledge you have read our privacy policy.

Not the answer you're looking for? Browse other questions tagged or ask your own question.