1

I'm using one the ArcGIS clustering samples in order to generate clustered points. This achieves the desired effect on the map and legend.

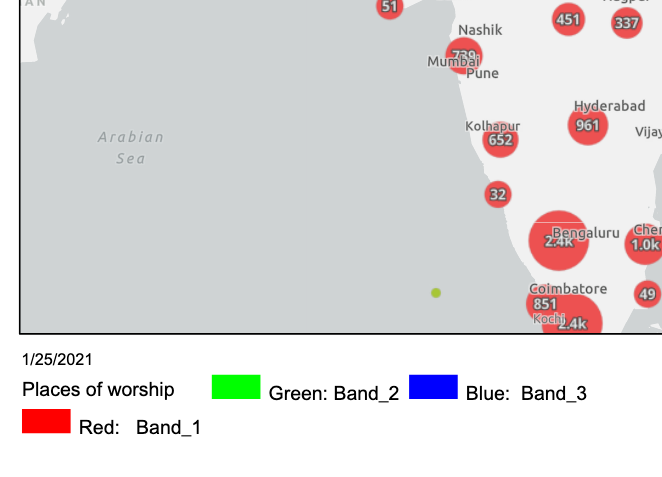
However, when I include the Print Widget in this sample, the resulting print-out has the clustered points layer split into separate bands for red, green and blue. My updated sample is at https://codepen.io/slead/pen/bGwPgeJ and prints like this:

enter image description here

(Hit the Export button on the print widget at the left to generate the print, then click on the PDF link in the Exported Files section of the print widget, in order to see the print-out.)

How can I print the legend as shown on the interactive map, rather than as RGB bands?

2 Answers 2

2
+100

Unfortunately, this is a known limitation, which is documented in the print widget: https://developers.arcgis.com/javascript/latest/api-reference/esri-widgets-Print.html

Printing layers using clustering will create a client-side image of the layer in the printout.

There is no current support for printing legend items for layers that are sent as a client-side image in the printout.

For a workaround, you can prevent the legend from being printed, or you can use a view.takeScreenshot() method: https://developers.arcgis.com/javascript/latest/sample-code/sceneview-screenshot/index.html

4
  • Thanks Noah. Can you please clarify "prevent the legend from being printed" - I tried adding legendEnabled: false on the layer, and while this doesn't show the legend on the map it still prints the RGB bands. Commented Feb 1, 2021 at 22:43
  • legendEnabled is a property of templateOptions of the Print widget: developers.arcgis.com/javascript/latest/api-reference/… which you can access via the Print widget here: developers.arcgis.com/javascript/latest/api-reference/… This will make it so legend is not printed by default with the print widget, but an end-user could still manually turn it back on in the widget.
    – Noah
    Commented Feb 2, 2021 at 23:19
  • thanks, got it. Unfortunately I'd like the legend to be displayed on the print-out, just without the broken clustered layer. Or ideally, with a non-broken clustered layer :) Commented Feb 3, 2021 at 0:32
  • 1
    The only workaround I know for that would be to include a Legend in the app, then use the view.takeScreenshot() method and include the app's Legend in the screenshot. here's a blog post that explains how this could be done (it's using popup instead of a legend in the example, but the same principle applies): community.esri.com/t5/arcgis-configurable-apps-blogs/…
    – Noah
    Commented Feb 5, 2021 at 16:52
1

It seems there is a bug, or maybe intentional behavior where the print widget just sends your layer as a raster layer to the printing server.

The map JSON it is sending is looking at your layer as an image. It is sending the image in base64:

{
  "operationalLayers": [
    {
      "type": "VectorTileLayer",
      "styleUrl": "https://cdn.arcgis.com/sharing/rest/content/items/291da5eab3a0412593b66d384379f89f/resources/styles/root.json",
      "id": "gray-base-layer",
      "title": "Light Gray Base",
      "opacity": 1,
      "minScale": 0,
      "maxScale": 0
    },
    {
      "type": "image",
      "extent": {
        "spatialReference": {
          "latestWkid": 3857,
          "wkid": 102100
        },
        "xmin": 7462819.579203828,
        "ymin": 464400.08928790176,
        "xmax": 10393109.495543566,
        "ymax": 4588330.639328634
      },
      "imageData": "A really long base64 that gave the picture below"
      "id": "1775c52f12f-layer-0",
      "title": "Places of worship",
      "opacity": 1,
      "minScale": 0,
      "maxScale": 0
    },
    {
      "type": "VectorTileLayer",
      "styleUrl": "https://cdn.arcgis.com/sharing/rest/content/items/1768e8369a214dfab4e2167d5c5f2454/resources/styles/root.json",
      "id": "gray-reference-layer",
      "title": "Light Gray Reference",
      "opacity": 1,
      "minScale": 0,
      "maxScale": 0
    }
  ],
  "mapOptions": {
    "extent": {
      "spatialReference": {
        "latestWkid": 3857,
        "wkid": 102100
      },
      "xmin": 7462819.579203828,
      "ymin": 464400.08928790176,
      "xmax": 10393109.495543566,
      "ymax": 4588330.639328634
    },
    "spatialReference": {
      "latestWkid": 3857,
      "wkid": 102100
    },
    "showAttribution": true,
    "scale": 18489297.737236
  },
  "exportOptions": {
    "dpi": 96
  },
  "layoutOptions": {
    "titleText": "",
    "authorText": "",
    "copyrightText": "",
    "customTextElements": [
      {
        "date": "2/1/2021"
      }
    ],
    "scaleBarOptions": {},
    "legendOptions": {
      "operationalLayers": [
        {
          "id": "1775c52f12f-layer-0"
        }
      ]
    }
  }
}
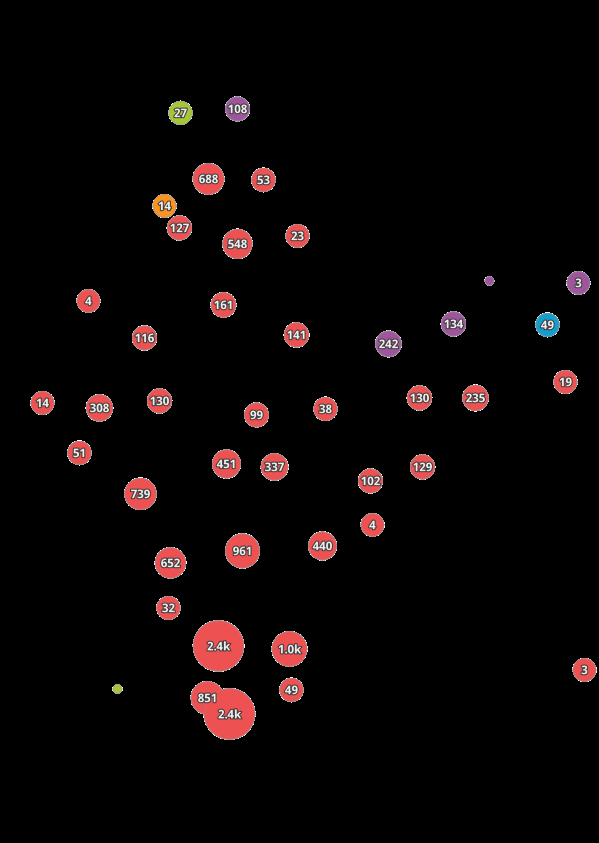
enter image description here

If you want to send a correct print JSON, I would recommend creating a simple button and using it to send the data yourself.

you can see the ExportWebMap specification on how to define the layer to your needs.

The rest of the request payload is relatively simple, for example:

Format: 'PDF'
Layout_Template: 'Letter ANSI A Landscape'
f: 'json'
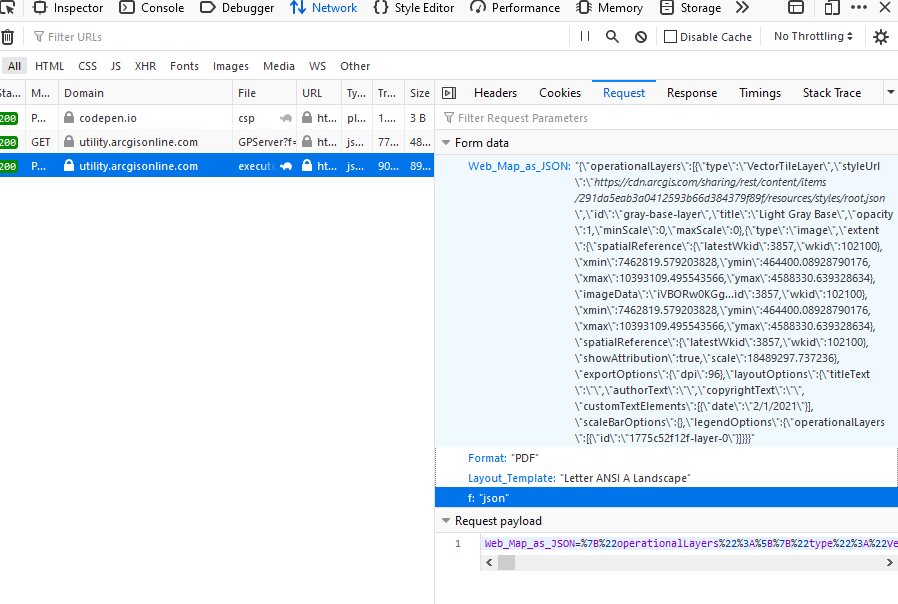
enter image description here

I would recommend replacing only the image layer (you can get it by name) from the JSON so you'd get the full configured JSON the print widget creates.

2
  • clever - thanks I should have thought of looking at the payload sent to the print server. I'll try your suggestion and let you know how it goes Commented Feb 1, 2021 at 9:06
  • thanks again for your input - always welcome. I awarded the bounty/fake-internet-points to Noah since "it's a known limitation" is probably the most correct answer Commented Feb 4, 2021 at 23:17

Your Answer

By clicking “Post Your Answer”, you agree to our terms of service and acknowledge you have read our privacy policy.

Not the answer you're looking for? Browse other questions tagged or ask your own question.