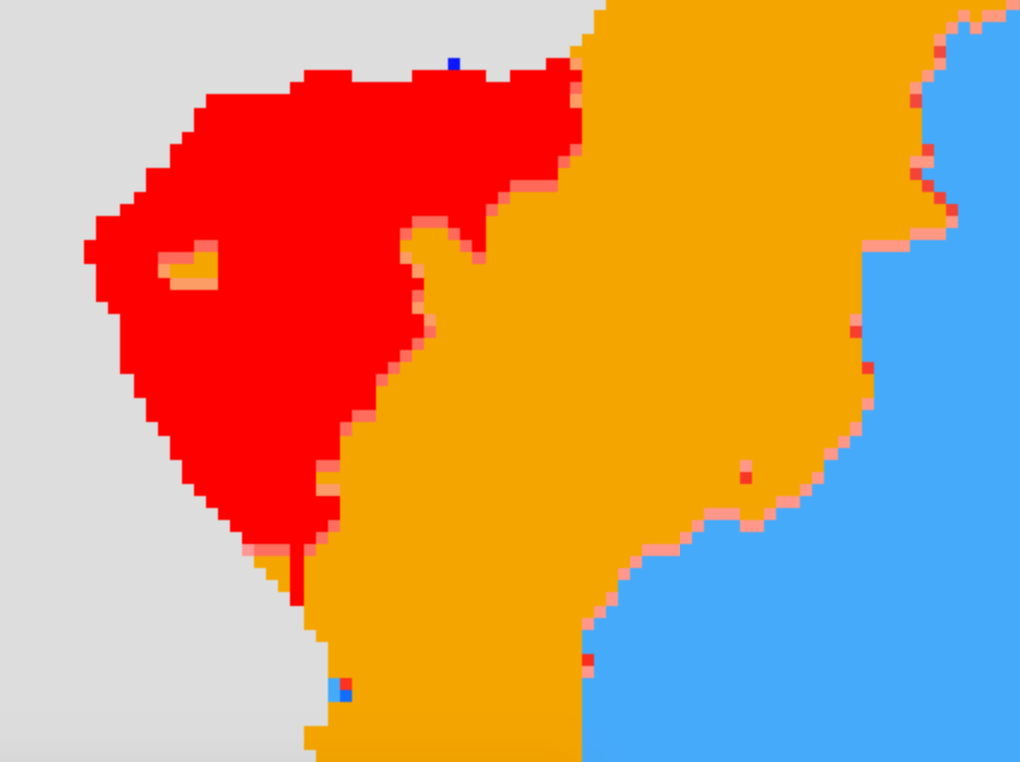
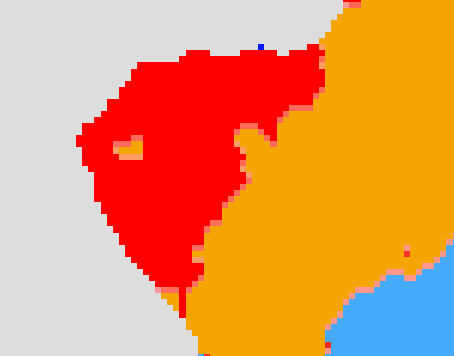
I am trying to plot a raster image using Leaflet, however I am having issues getting the colours right.
I've read in the raster like this and plot the the resulting raster variable.
library(raster)
library(leaflet)
ras<-raster("https://raw.githubusercontent.com/jodyphelan/jodyphelan.github.io/master/img/test.tif")
plot(ras)
But when I try to plot the raster using leaflet and the addRasterImage() function there are two things I notice. Firstly, it looks as its it is doing some kind of antialising between the colours. Secondly, it is putting some colours in that shouldn't be there.
pal<-colorNumeric(ras@legend@colortable,0:255,na.color = "transparent")
leaflet() %>% addRasterImage(ras,colors = pal)
This is the raster produced using plot():
 An this is the one produced using leaflet:

The questions are:
- Is it possible to disable the antialising-like behaviour?
- Why is it changing colours of some squares?
I'm also not entirely sure whether I am creating the pallete in the right way. Any tips on these questions?


