1

I'm a Norwegian student currently conducting a series of site analyzes for a city. In that context I wish to create a building density map but struggle a bit to find out how.

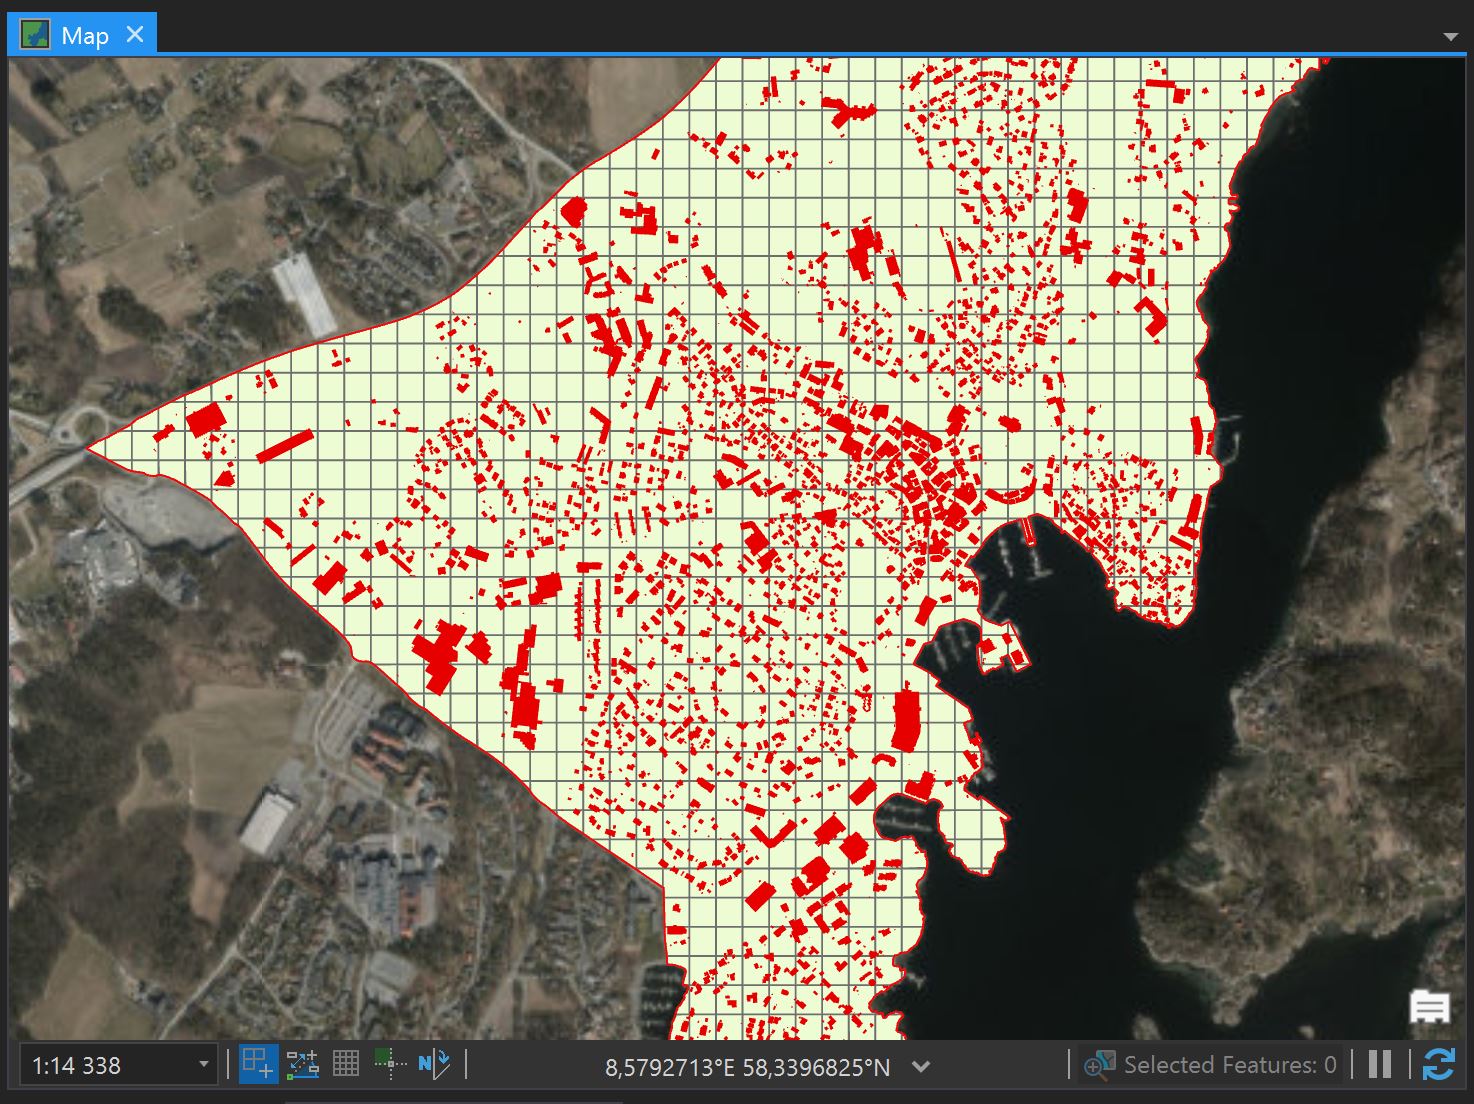
I have made a fishnet polygon of 50x50 meter and wish to find out how much built area there is in each of these squares. My goal is to color the squares according to how much percent of the squares are built area. Both the fishnet and the buildings are polygons and are editable. Please see the image.

Can anyone help me perform the analysis?

enter image description here

4
  • What licenses do you have access to? Depending on this, there are several approaches for example "Summerize Within (Analysis)".
    – MarcM
    Commented Feb 17, 2021 at 9:53
  • Thanks for the tip, that worked perfectly!
    – Stian
    Commented Feb 17, 2021 at 11:36
  • You could also use the Union tool.
    – Hornbydd
    Commented Feb 17, 2021 at 20:14
  • You could also just define the cell size of the density tool to the same as your fishnet. Commented Feb 18, 2021 at 2:38

1 Answer 1

1

There are several ways how to do it. Many are already covered on this site as well. Depending on licenses, you can use Summerize Within (Analysis) in ArcGIS Pro for this purpose.

Your Answer

By clicking “Post Your Answer”, you agree to our terms of service and acknowledge you have read our privacy policy.

Not the answer you're looking for? Browse other questions tagged or ask your own question.