I'm trying to calculate the NDVI for a scene, and I've downloaded Landsat 8 OLI/TIRS Collection 2 Level 2 data, which means it has already been processed to surface reflectance.
The scaling factors for Collection 2, however, are new, and include an "additive" factor in addition to a multiplication factor. Following the specification then, I multiplied all the cell values in my scene by 0.0000275 and subtracted 0.2. Here is a simplified example (I'm working in R and using the raster and terra libraries):
library(raster)
library(terra)
library(tidyverse)

# Getting the names of all the Surface reflectance band files
filenames <- paste0("landsat/LC08_L2SP_048026_20200805_20200916_02_T1/LC08_L2SP_048026_20200805_20200916_02_T1_SR_B", 1:7,".TIF")

# Loading them as a raster stack
aug20 <- terra::rast(filenames)

# Setting band names
names(aug20) <- c('ultra-blue', 'blue', 'green', 'red', 'NIR', 'SWIR1', 'SWIR2')

# Applying scaling factors (these operations are applied to every layer in the stack)
aug20 <- (aug20*0.0000275) - 0.2
I assumed that this manipulation should be enough but I ran into 2 pretty major issues. First, the resulting "surface reflectance" values have a range that far exceeds 0 and 1 on both sides:
# Summary of the stack, showing that all bands are beyond the 0 and 1 range
print(aug20)
> aug20
class       : SpatRaster
dimensions  : 8051, 7951, 7  (nrow, ncol, nlyr)
resolution  : 30, 30  (x, y)
extent      : 283485, 522015, 5292285, 5533815  (xmin, xmax, ymin, ymax)
coord. ref. : +proj=utm +zone=10 +datum=WGS84 +units=m +no_defs
source      : spat_jvKP7k9AhCUT5B3.tif
names       : ultra-blue,       blue,      green,        red,        NIR,      SWIR1, ...
min values  : -0.1999725, -0.1999725, -0.1999725, -0.1999725, -0.1156025, -0.0204800, ...
max values  :   1.243200,   1.257198,   1.274935,   1.317257,   1.480910,   1.527193, ...
To account for this I tried to set everything greater than 1 to 1 and everything less than 0 to 0, but I'm not sure if this is appropriate since I don't know how to interpret these out of range values.
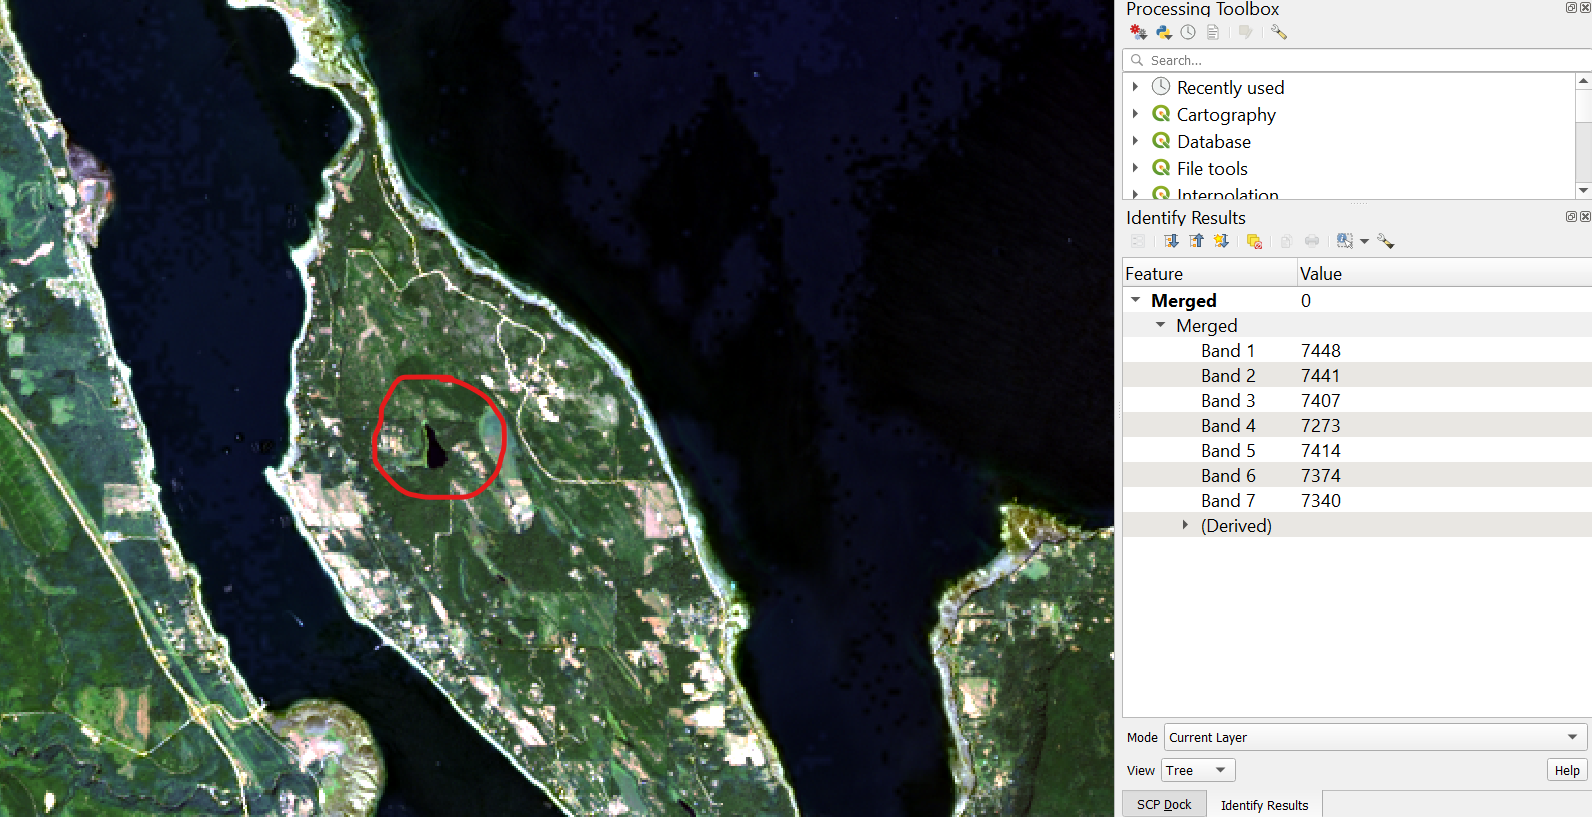
Second, and more importantly, when I try to calculate the NDVI, the results are completely wrong for some pixels. For example, some areas that I know to be water have "unscaled" values that are as low as 7300-7500 across all bands. The image shows a sample of pixel values inside this known water area using QGIS (this image is a true-colour composite):
The issue is that since the scaling factor involves both multiplication and subtraction, the resulting SR values end up being extremely small for all bands over water, which in turn means that calculating an NDVI ratio between then returns a REALLY high value which signals dense vegetation (for pixels that I know to be water!)
# Using the sample cell values from above as an example, applying the rescaling factor:
b5_scaled <- (7414*0.0000275) - 0.2
[1] 0.003885
b4_scaled <- (7273*0.0000275) - 0.2
[1] 0.0000075

# NDVI for this pixel (WAY too high for water):
(b5_scaled - b4_scaled)/(b5_scaled + b4_scaled)
[1] 0.9961464
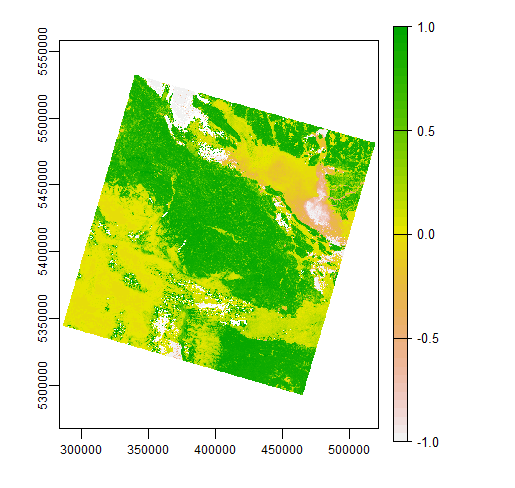
This is a simplified example to illustrate where the issue is, but it is affecting the scene overall where an NDVI calculated on the "scaled" data totally obscures water while calculating it on the "unscaled" data manages to capture it just fine:
# Plot of unscaled NDVI (left)
plot((aug20_unscaled$NIR - aug20_unscaled$red) / (aug20_unscaled$NIR + aug20_unscaled$red))

# Plot of scaled (right)
plot((aug20_scaled$NIR - aug20_scaled$red) / (aug20_scaled$NIR + aug20_scaled$red))
I'm working with several tiles, and this seems to be an issue with all of them so I don't think it is a feature of just this single tile. I'm really not sure what to do. I will likely be reverting to just using Collection 1 data for the time being but I'd still really like to know if I'm just missing something obvious or there is another way to resolve this.


