2

I have a contour file for the Brazilian state of Rio de Janeiro (available here https://www.arcgis.com/home/item.html?id=c575d42b3f114d7da4784a337b42dcd9) and need to convert it into a DEM raster file.

I have found many tutorials on how to do that but for some reason, I am unable to produce a DEM.

Following this tutorial (https://www.youtube.com/watch?v=-euJdFYPzdM&ab_channel=Q-tips), this is what I have done:

On Qgis:

1st step: Layor > Add Layor > Add Vector Layor (select my contour)

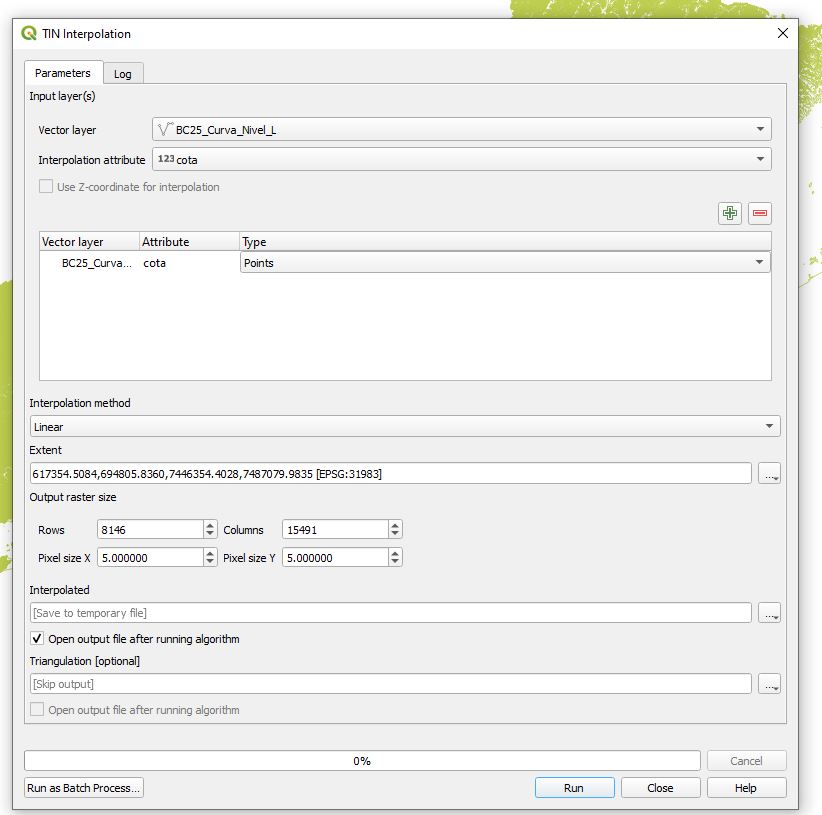
2nd step: TIN interpolation > Select Variable with info about elevation (in my case, "cota") > Select Extent (I used the "draw on canvas" function to select the city of Rio de Janeiro only).

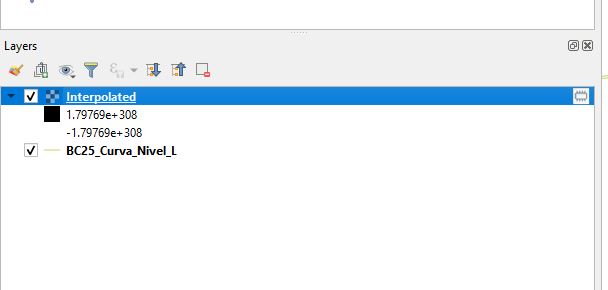
Once the process is done, my result looks nothing like the one in the video. It seems that nothing really was produced. If I either select or not the "Interpolated" layer, nothing changes on the plot. The values also look weird (see print screen).

I am very new to GIS so I am guessing this is very trivial. After googling a lot, I am still lost though.

enter image description here

enter image description here

4
  • Is there a link from that first URL you give that downloads the data? I can't see it, and maybe its my inability to read portuguese. None of the links in the "Informação de Distribuição" seem to download it or go anywhere useful.
    – Spacedman
    Commented Apr 15, 2021 at 8:45
  • Oh, yes, it is definitely not easy to find. The link for download is under "Opções de Transferência Digital" (Digital Transference Options).
    – Miranda
    Commented Apr 15, 2021 at 19:39
  • I see three links under that heading - an FTP link that doesn't work unless I change RJ to rj, and that leads to two directories versao2016 and versao2018 - and two web mapping links that don't show downloads for contours. Is it somewhere on the ftp site, like: geoftp.ibge.gov.br/cartas_e_mapas/bases_cartograficas_continuas/… ?
    – Spacedman
    Commented Apr 15, 2021 at 19:53
  • Yes, no idea why the link is all weird. You can download the contours from here instead: arcgis.com/home/item.html?id=c575d42b3f114d7da4784a337b42dcd9 Thank you!
    – Miranda
    Commented Apr 16, 2021 at 22:16

1 Answer 1

1

Your output layer limits are in a different projection (SIRGAS/UTM23S) to the input BC25 data (OGC:CRS84). They don't overlap, so you get no data.

Make sure your project projection is CRS84 (bottom-right corner) and that your BC25 layer is visible.

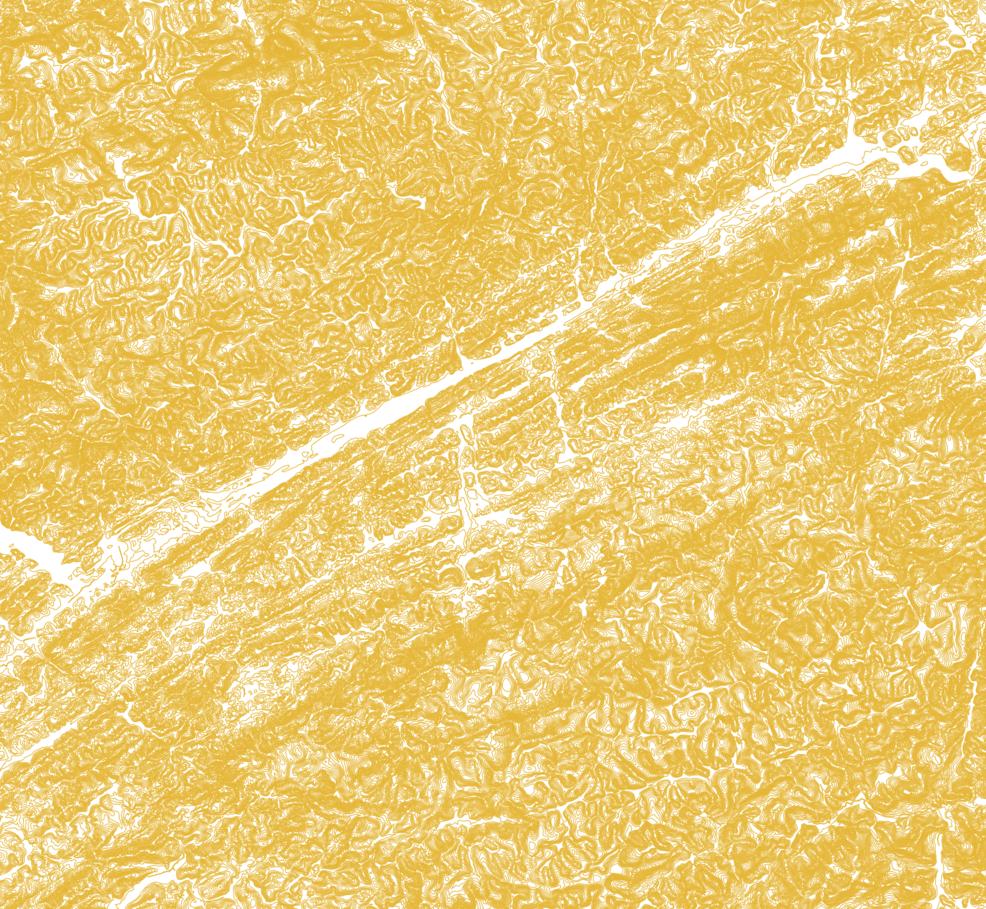
Here is an example, where I have zoomed in to my area of interest (Tres Rios area).

enter image description here

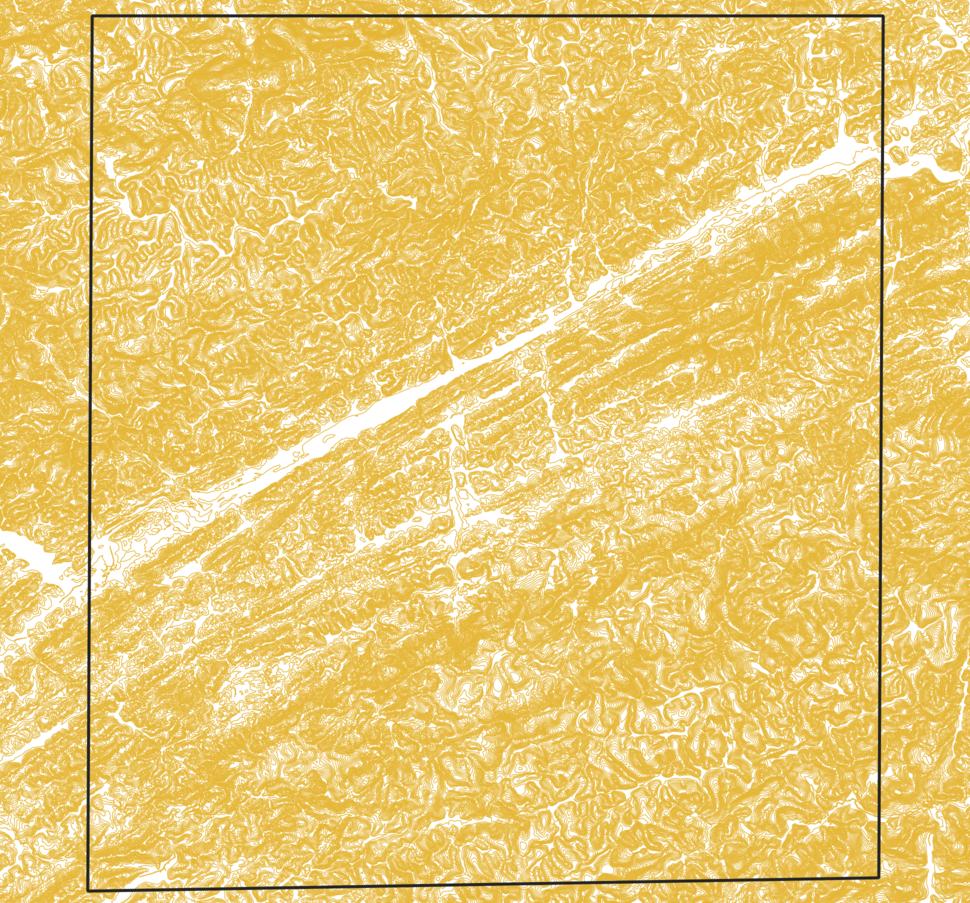
  1. Create a polygon in CRS84 that defines the limits of area you want. Set it to CRS84.

enter image description here

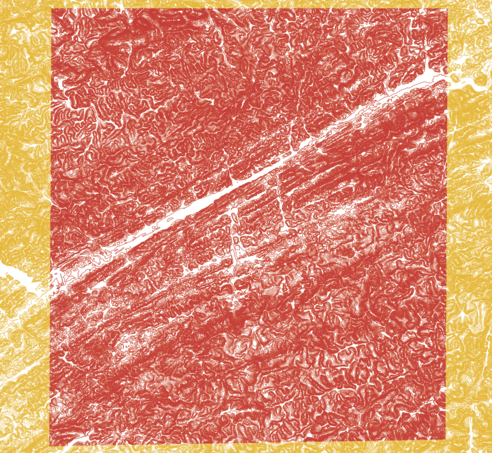
  1. Clip the BC25 data with this layer (Vector - Geoprocessing Tools - Clip). Set the CRS of the output Clipped layer to CRS84.

enter image description here

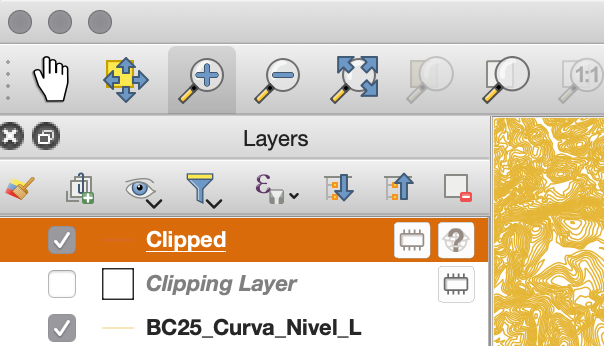
The question mark (?) means it didn't pick up the CRS84 CRS, so aadd it manually)

enter image description here

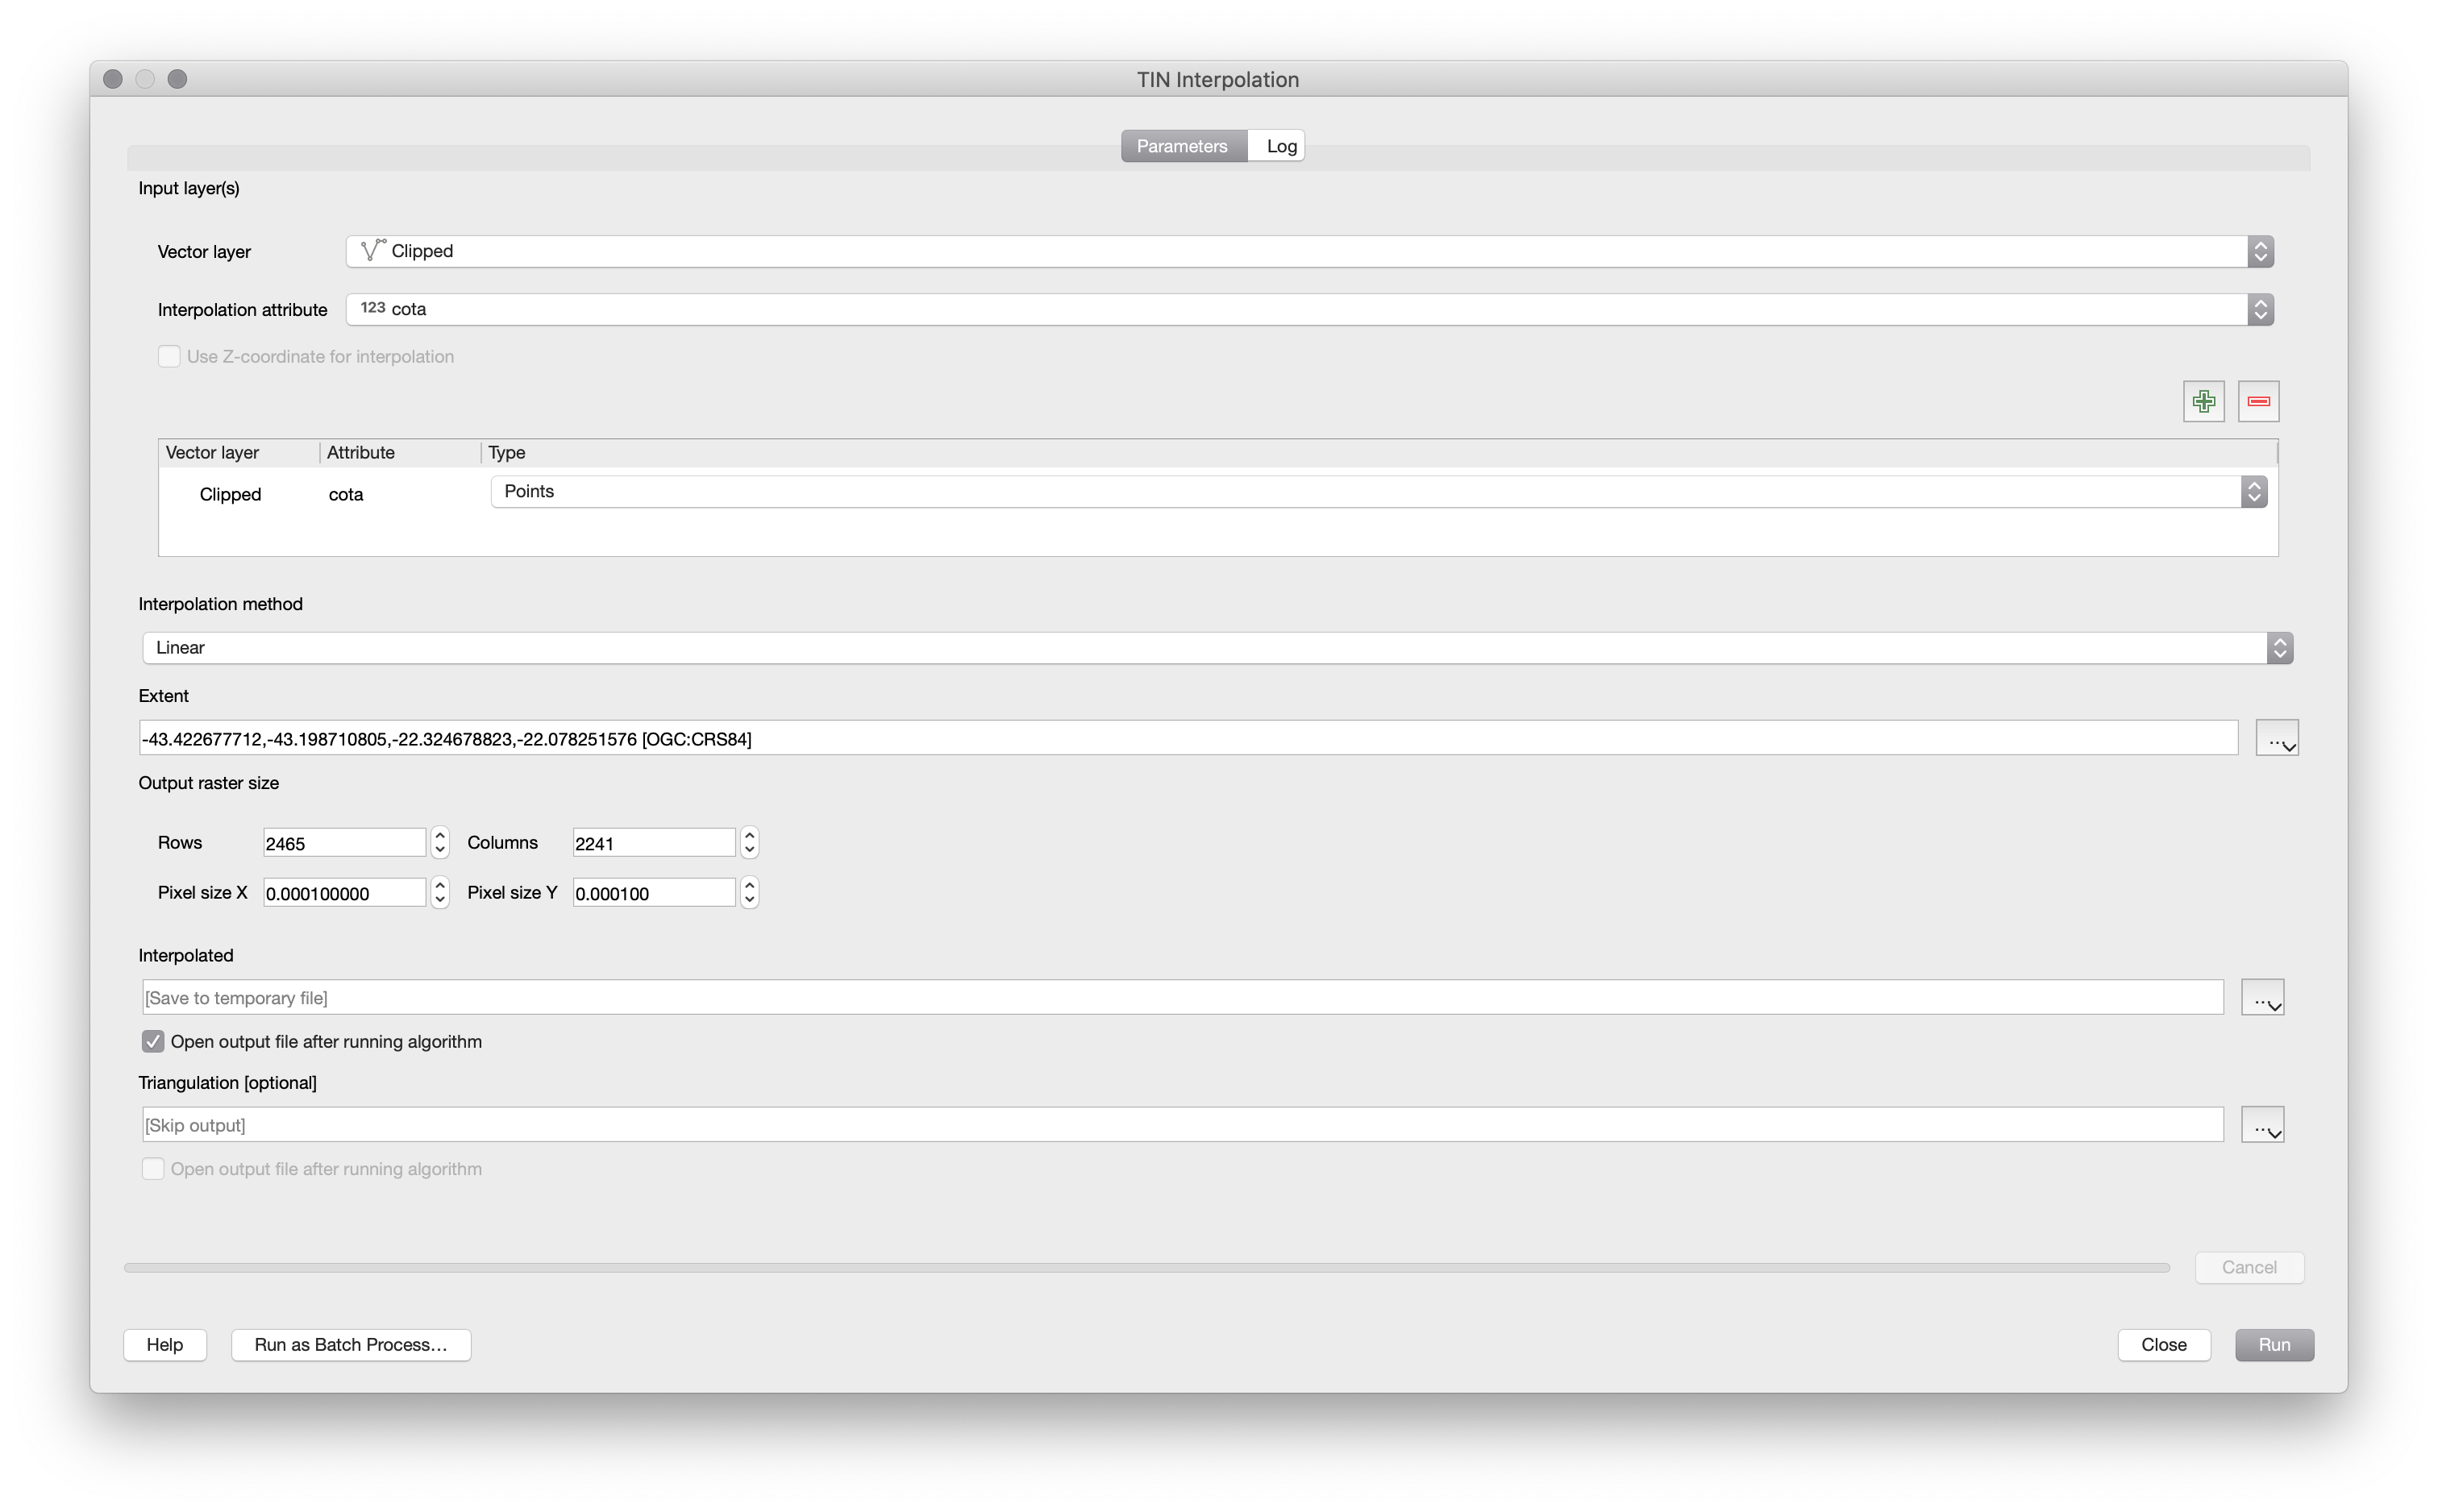
  1. Run the TIN algorithm on the Clipped Layer instead of the full BC25 layer. It saves a lot of time. Make sure your Extent is set from the Clipped layer. It should also show you the CRS as CRS84.

enter image description here

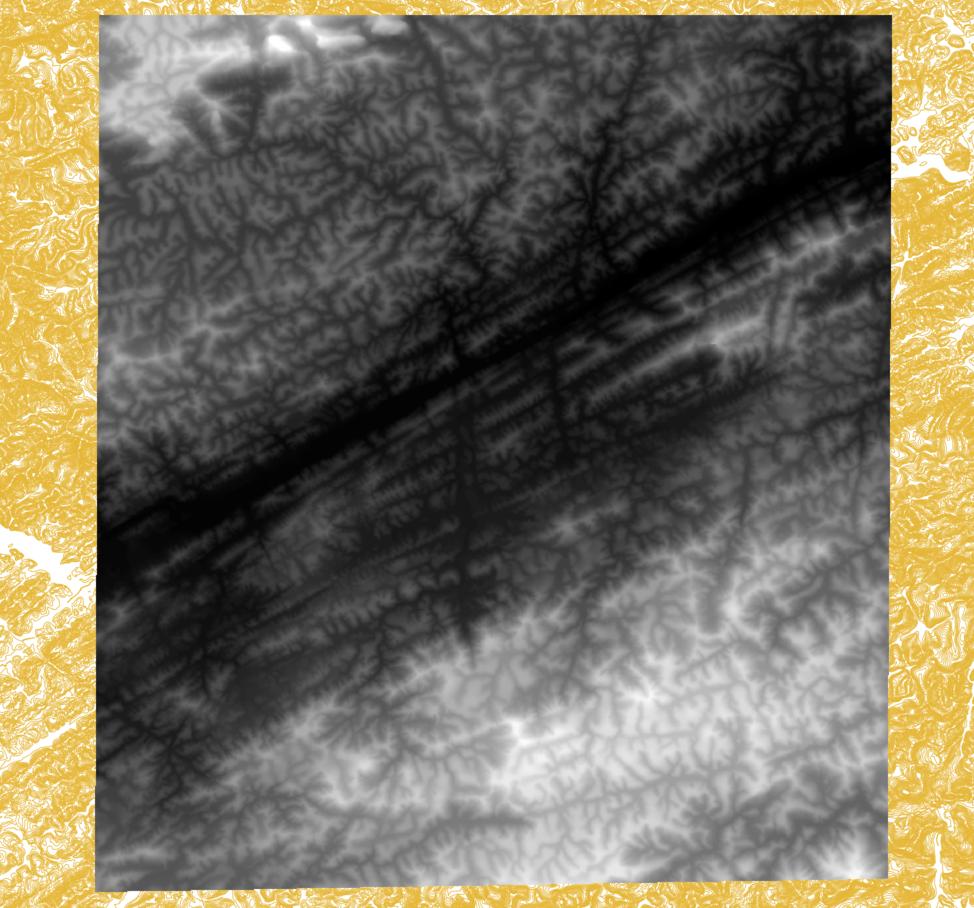
This gives the required grid:

enter image description here

Your Answer

By clicking “Post Your Answer”, you agree to our terms of service and acknowledge you have read our privacy policy.

Not the answer you're looking for? Browse other questions tagged or ask your own question.