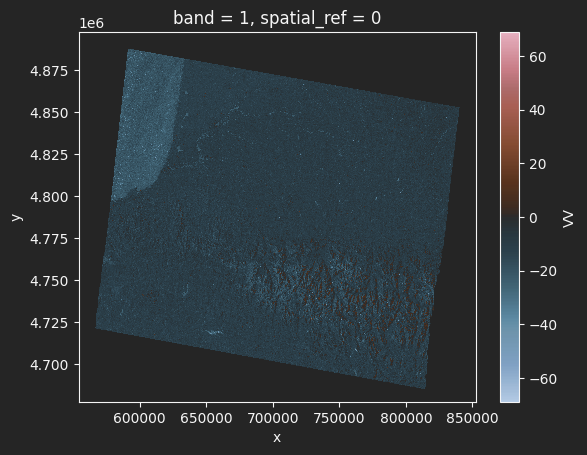
I'm trying to work with satellite data for the first time and running into problems. I find the documentation about using Sentinel-1 data in Python lacking, but maybe I'm searching for the wrong things.
I have downloaded a Sentinel-1 granule from the copernicus.eu website, and now I'm trying to get some usable visualization going in Python.
I started with the following small script which I've adapted from rasterio's documentation:
import rasterio
from matplotlib import pyplot as plt

path = '/x.SAFE/measurement/y-00n.tiff
src = rasterio.open(path)
array = src.read(1)
pyplot.imshow(array, cmap='pink')
plt.show()
However, I get the following error message:
TypeError: Image data of dtype complex128 cannot be converted to float
which stems from the fact that the values in array are complex.
How do I go about visualizing this data? Feel free to point me to it should I have missed some obvious documentation, but I couldn't find anything that helped me after googling this for several hours.
PS: I'm not set on using rasterio, but it seemed to be made for this purpose.

