3

Main goal: Create pandas DataFrame from raster image - one row per pixel

I have been using this resource

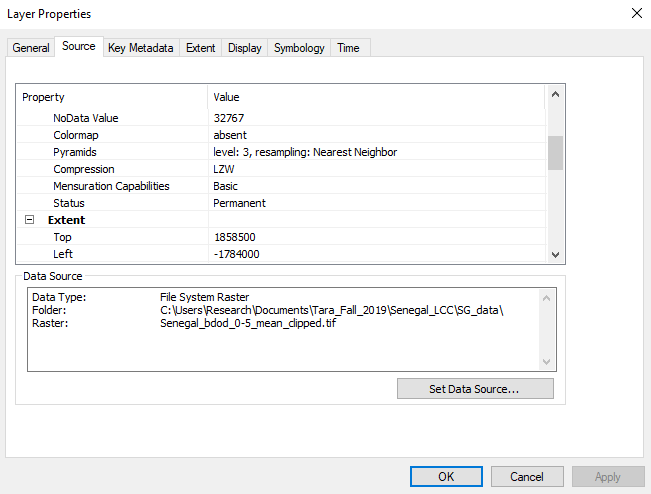
Main problem: Rasterio is improperly marking every pixel as NoData instead of pulling the proper values

I am working with .tif files from SoilGrids.org which give soil attributes such as sand, silt, clay, ph, etc.. Each .tif file has only one band. When I open the .tif files in ArcMap, I clearly see the values of the raster and everything displays properly.

When I display in rasterio using

img=rasterio.open("C:\\Users\\Research\\Documents\\Tara_Fall_2019\\Senegal_LCC\\SG_data\\Senegal_cec_0-5cm_mean_clipped.tif")
show(img,0)

I get the following image which shows the correct raster plot of band 1

but when I try to pull the actual data using

#read image 
band=img.read(1)
band

I get an array full of nodata values enter image description here

For reference, here are the properties of the raster pulled from arcmap enter image description here enter image description here enter image description here enter image description here

I have tried opening other .tif rasters from the same source with all the same properties and have the same problem. My guess is it is something wonky about the properties of the .tif files.

0

1 Answer 1

3

What makes you think it's all nodata? Just when you print out the array?

When you're printing out the array you only see three row and column values from each corner, which in this case are nodata.

Try printing out some stats instead:

tif = "mydata.tif"

with rasterio.open(tif) as img:
    band = img.read(1, masked=True)  # read band 1, return a nodata MaskedArray
    print(band)
    print(band.min(), band.max())

For my data, this outputs the following. Note the -- values are how a MaskedArray represents nodata values

[[-- -- -- ... -- -- --]
 [-- -- -- ... -- -- --]
 [-- -- -- ... -- -- --]
 ...
 [-- -- -- ... -- -- --]
 [-- -- -- ... -- -- --]
 [-- -- -- ... -- -- --]]  <-- Can only see nodata
211 351                    <-- But there are other values

If I don't ask for a MaskedArray, I can still see that it is not returning all nodata values as the min is still the same:

with rasterio.open(tif) as img:
    band = img.read(1)  # read band 1, return a numpy ndarray
    print(band)
    print(band.min(), band.max())

Output:

[[32767 32767 32767 ... 32767 32767 32767]
 [32767 32767 32767 ... 32767 32767 32767]
 [32767 32767 32767 ... 32767 32767 32767]
 ...
 [32767 32767 32767 ... 32767 32767 32767]
 [32767 32767 32767 ... 32767 32767 32767]
 [32767 32767 32767 ... 32767 32767 32767]]  <-- Can only see nodata
211 32767                                    <-- But there are other values
1
  • Thank you so much!! I am new to rasterio and was so confused. This was very helpful.
    – Tara
    Commented Jun 14, 2021 at 15:56

Your Answer

By clicking “Post Your Answer”, you agree to our terms of service and acknowledge you have read our privacy policy.

Not the answer you're looking for? Browse other questions tagged or ask your own question.