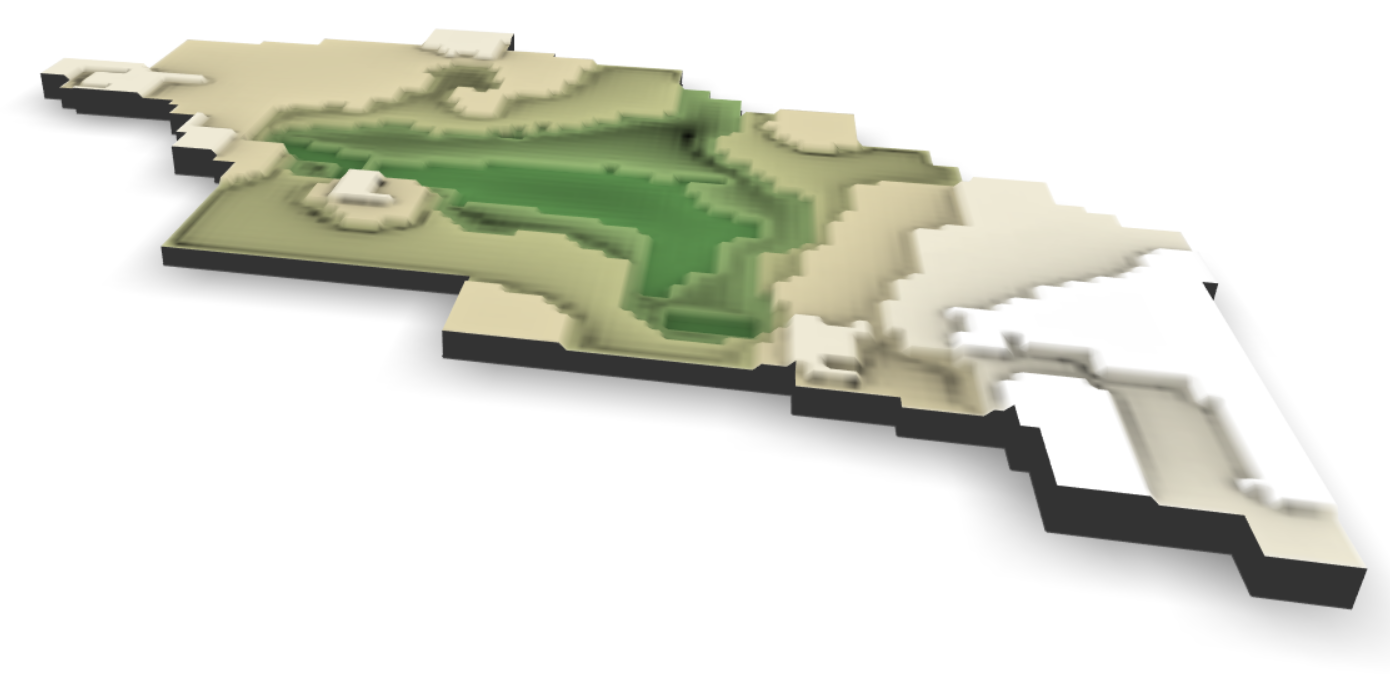
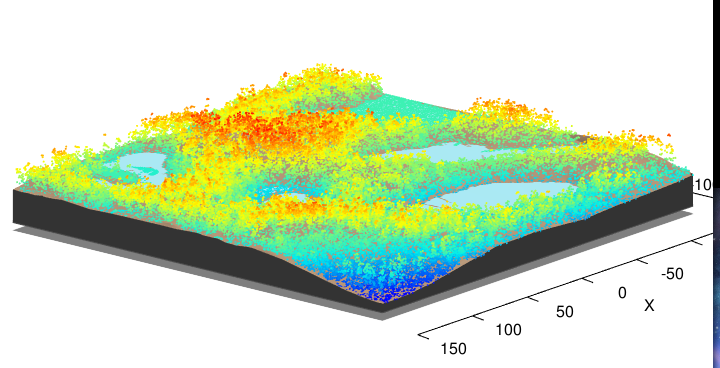
The rayshader package in R allows beautiful 3D modeling in R. Now I was trying to first try and overlay a LAS file on top of a base-map which is a Rayshader array object. I was trying %>% to link the two objects but it doesn't overlay the two objects in the RGL window and I get an error. The purpose is to do 3D LiDAR modeling. Can something similar to this be achieved?
To create a base-map using rayshader, I first took a digital terrain model (DTM) raster, second converted it to a raster and then:
TLS_LAS_DTM = raster("~/DTM_Raster/tls_las_dtm.tif")

# Use the Rayshader package
library(magick)
TLS_LAS_DTM_mat = raster_to_matrix(TLS_LAS_DTM )

TLS_LAS_Basemap = TLS_TP1_DTM_mat %>%
  height_shade() %>%
  add_shadow(lamb_shade(TLS_LAS_DTM_mat ,zscale = 6),0) %>%
  add_overlay(sphere_shade(TLS_LAS_DTM_mat , texture = "desert",
                           zscale=4, colorintensity = 5), alphalayer=0.5) %>%
  add_shadow(ambient_shade(TLS_LAS_DTM_mat ), 0) %>%
  add_shadow(texture_shade(TLS_LAS_DTM_mat ,detail=8/10,contrast=9,brightness = 11), 0.1)
Then I took a LAS object (data.frame/data.table) which was tree segmented using silva2016 method and passed it to the plot function to open it in an RGL window.
plot(TLS_LAS.ITD.dalponte.p2r) %>%
TLS_LAS_Basemap %>%
  plot_3d(TLS_LAS_DTM , windowsize=c(1200,800))
#> Error in plot_3d(., TLS_TP1_DTM_mat, windowsize = c(1200, 800)) :
#> Argument `hillshade` must not contain any entries less than 0 or more than 1
The base-map looks like this


