Some background to explain what I have done, and thus my current question (at the end).
I am trying to find a way to get a list of the distances between sites of a certain class to the nearest site of a different class, along a given road network.
If I use the "Distance to nearest hub (points)" I get a list of distances or with MMQGIS "Hubs/Lines Distance" I get lines to the closest sites, but not along the road. (The two methods also seem to result in slightly different numbers [e.g., 13,684m versus 13,654m])
The Vector Analysis > distance matrix produces a list, but listing every distance, not the shortest, and it also does not allow for usage of the road network.
If I use the QNEAT3 > routing > shortest path (point to point) I get a result that uses the road system, but it outputs a cost for an unknown unit (is it meters/km/time/energy or something else? e.g., "cost on graph" 3040.1860093 or total cost 38338.3270700). However, I have 1465 sites, so I cannot do this one by one.
The OD Matrices produces tables, and the Layers as Lines option allows one to produce a list of sites of one type to another. Thus it appears to do what I need, but I need to interpret the output. It outputs extry cost, network cost, exit cost, and total cost. I cannot find documentation that tells me what unts these numbers represent. (cf description here: https://root676.github.io/OdMatrixAlgs.html) Are they meters?
For example, one site for which the basic hub distance (without the road network) gives a distance of 13,684 meters, and the OD Matrix gives the following costs: entry 1440.8991346 network 88264.5431346 exit 675.5143279 total 90380.9565971
Does anyone know what these numbers represent in either QNEAT3 method?
EDIT: QNEAT3 appears to output in meters. But the issue with the Matrix is it outputs distance to every other site, not just to the closest.
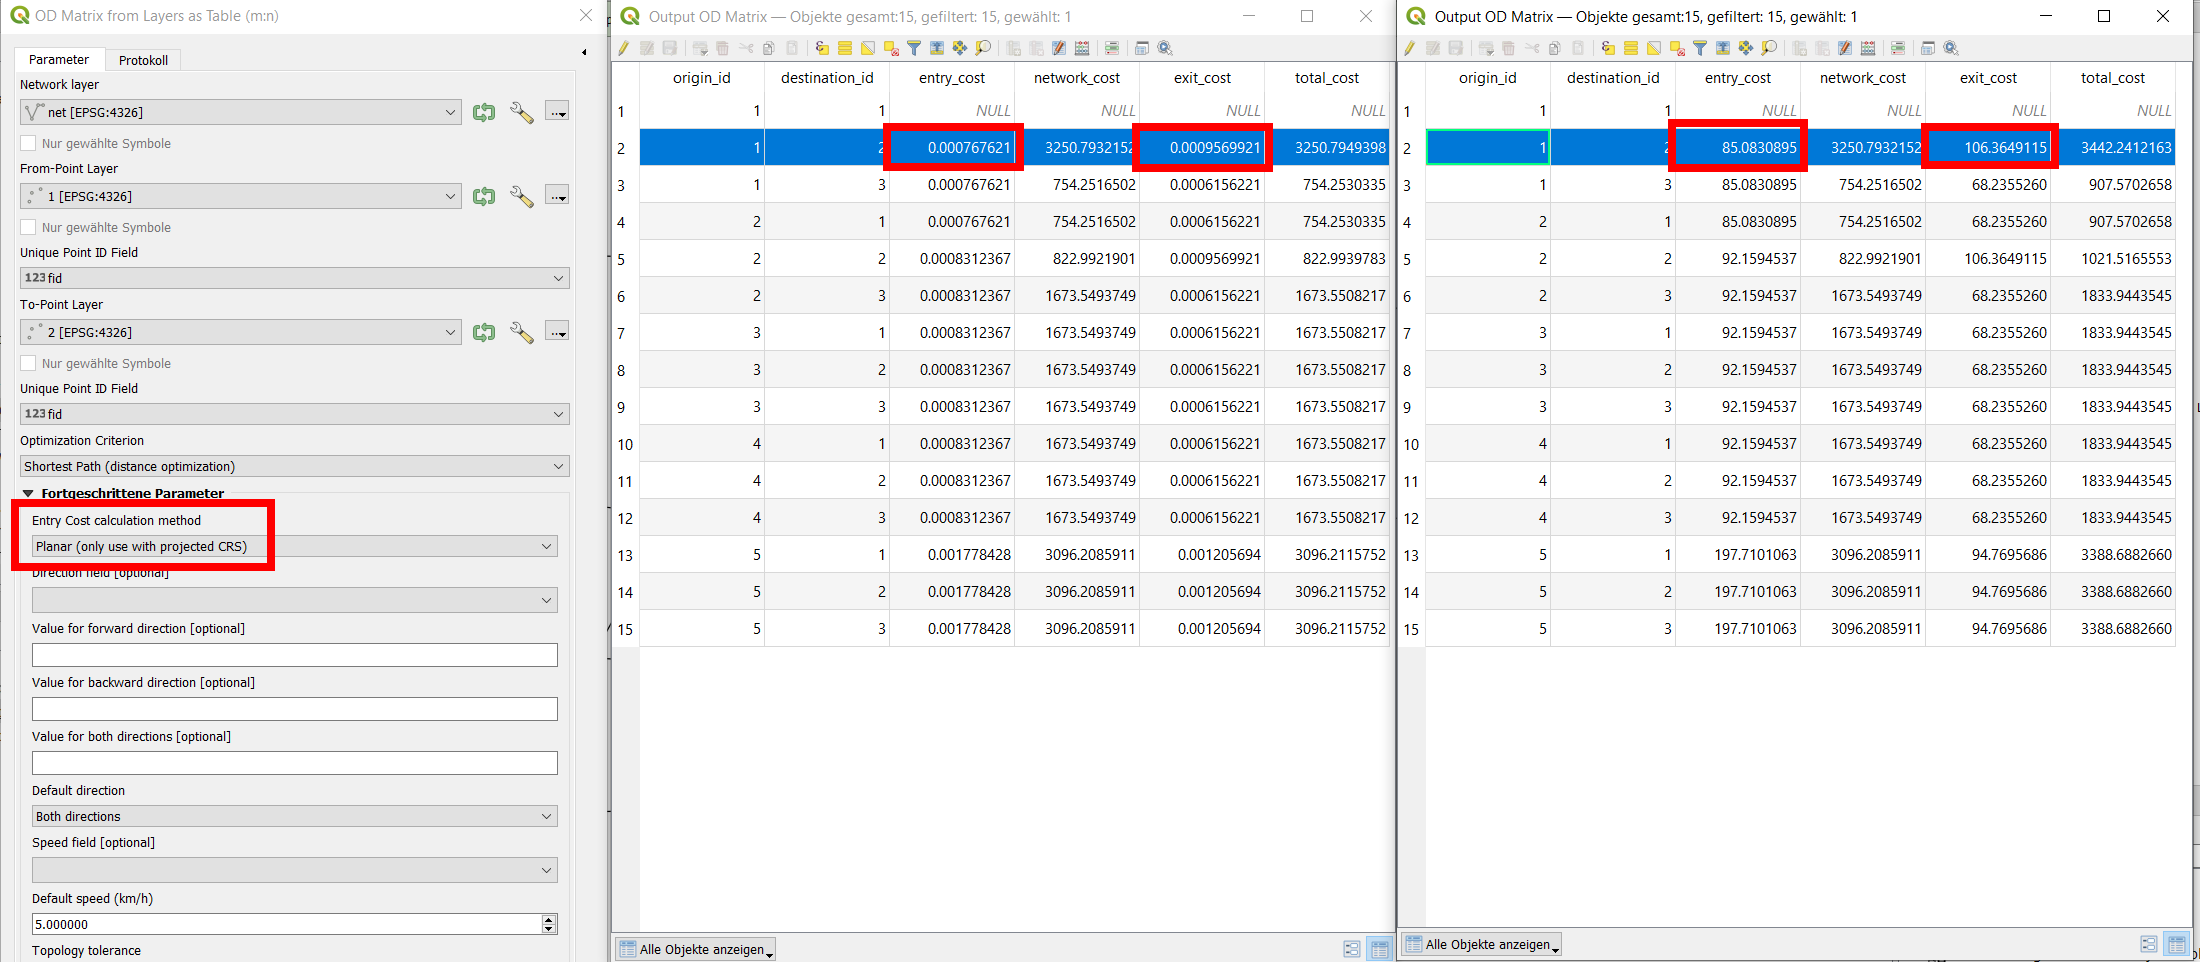
EDIT: Please see the below screenshots:
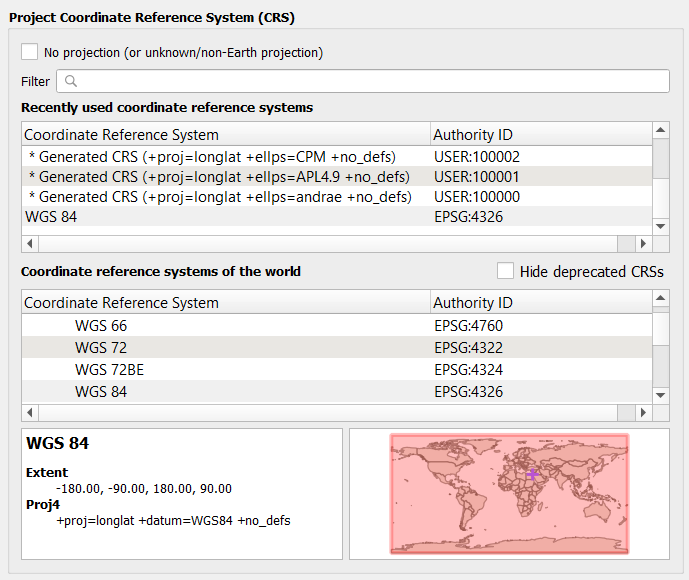
Project CRS
 Output of Least-Cost Path
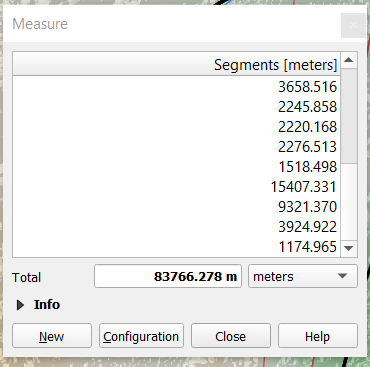
 Output of measuring tool between same two sites


