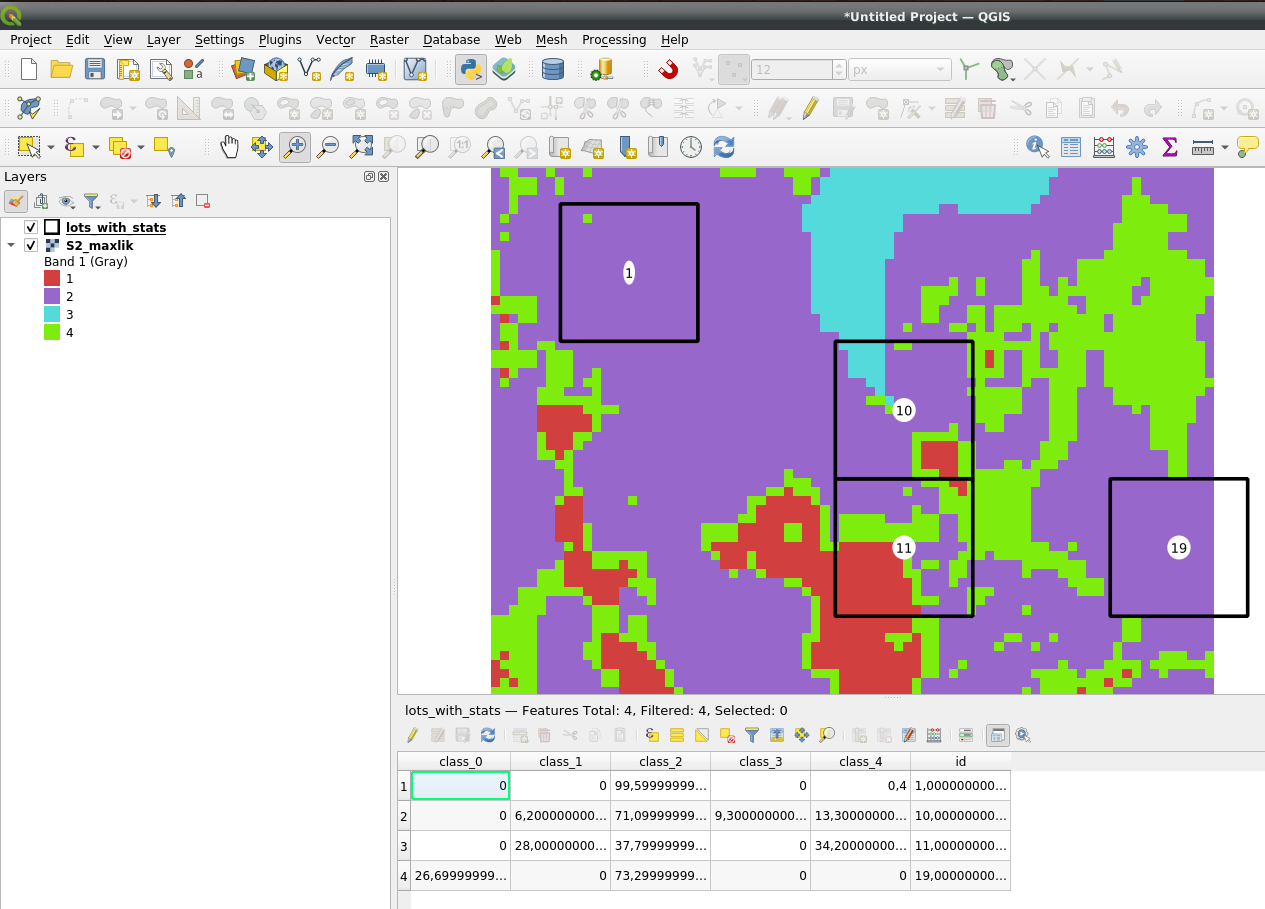
rasterstats zonal_stats with categorical=True.
For example with pandas so you can manipulate the data as you like:
import geopandas as gpd
import pandas as pd
from rasterstats import zonal_stats

lots = gpd.read_file(r'/home/bera/Desktop/tempgis/lots.shp')
raster = r'/home/bera/Desktop/tempgis/S2_maxlik.tif'

zs = zonal_stats(vectors=lots['geometry'], raster=raster, categorical=True)
stats = pd.DataFrame(zs).fillna(0) #One column per raster category, and pixel count as value
stats_percentage = stats.apply(lambda x: round(x/x.sum()*100,1), axis=1) #From pixel count to percentage

#      2     4     1    3     0
#0  99.6   0.4   0.0  0.0   0.0
#1  71.1  13.3   6.2  9.3   0.0
#2  37.8  34.2  28.0  0.0   0.0
#3  73.3   0.0   0.0  0.0  26.7

#Rename columns
stats_percentage = stats_percentage.rename(columns={0:'class_0',
                                                      1:'class_1',
                                                      2:'class_2',
                                                      3:'class_3',
                                                      4:'class_4'}, errors="raise")

#Merge(=join) the results back to your input
results = pd.merge(left=lots, right=stats_percentage, how='left', left_index=True, right_index=True)
results = results.reindex(sorted(results.columns), axis=1) #Sort columns by name
results.to_file(r'/home/bera/Desktop/lots_with_stats.shp')


