3

I am working on a project to determine the coastal vulnerability. I have different variables like elevation, LULC, bathymetry, etc. of the entire study area. I am stuck in the middle of my analysis.

My analysis steps would loosely be based on the value extraction method followed in this paper (Earth Observation Technique-Based Coastal Vulnerability Assessment of Northern Odisha, East Coast of India). In my understanding, the authors here have extracted the value of different input parameters to some point along the coastline. Then used the CVI equation on the attributes of those points to find the CVI value (please correct, if I am wrong).

My problem is, I have no idea how to transfer these input raster values to point. I have come across one question, that recommended the use of the focal statistics tool of ArcMap. But I want to extract the data from my entire study area, not just over a certain radius.

Can you give me some hints?

I am doing processes in ArcMap.

enter image description here

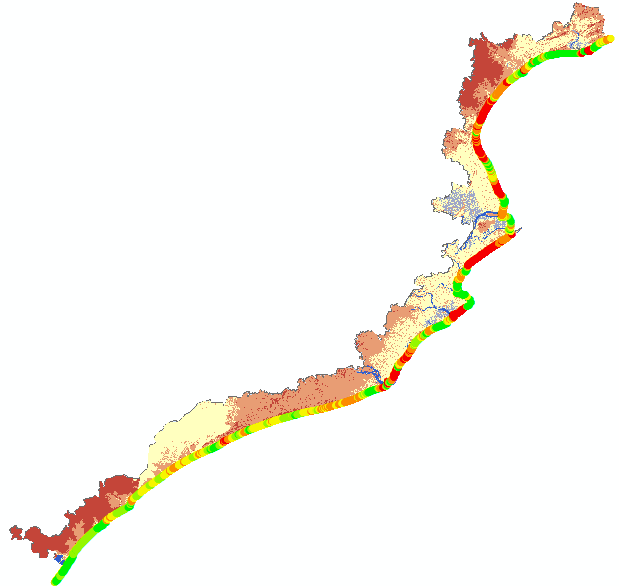
The image shows my study area. The area is covered with elevation raster. The red, orange, green, and yellow points are the points to which I want the data to be extracted.

The answer to this question doesn't solve my problem.

7
  • No, the tools mentioned in the link will extract the raster value at those particular points. I want to extract value from my entire study area to those points
    – Badal
    Commented Oct 24, 2021 at 5:10
  • So for example taking a single green point are you asking you want to know every single pixel in your study area, so if you had 1 million pixels you duplicate that green point 1 million times? So if you have 100 points along the coast you will create a dataset of 100 million points?
    – Hornbydd
    Commented Oct 24, 2021 at 11:01
  • No, I am saying that what I have understood from the attached paper is, they have represented the entire raster of the study area in those points. I have no idea how they have done it. As I have to do numerical calculations involving all the input data, all have to be attached to the attribute table of a single feature class so that the output can be derived along the coast. It will be very helpful if you could go through the paper.
    – Badal
    Commented Oct 24, 2021 at 14:25
  • 1
    Well spotted. This is a classic example of an academic paper stepping over the complexity of their methodology which is especially true for spatial processing and that's why metadata is so important! Your simple question of how did they actually do it is not explained sufficiently by their methodology and should have been picked up by the reviewers and editor. They appear to have attached population to the village boundaries, that gives you the density for the admin area. I can only guess they buffered the point 5Km and intersected? Nothing wrong in contacting the author.
    – Hornbydd
    Commented Oct 26, 2021 at 9:04
  • 1
    Thank you for your comments. I have just sent the mail to the author.
    – Badal
    Commented Oct 26, 2021 at 11:34

2 Answers 2

3

Here are all the available methods you can use to transfer Raster values to Points using ArcGIS Desktop or Pro: https://support.esri.com/en/technical-article/000022163

Since you have many points, Extract Multi Values to Points is the tool you want to use.

4
  • These tools will extract the raster value at those particular points. I want to extract value from my entire study area to those points, not from the area just on the points.
    – Badal
    Commented Oct 24, 2021 at 4:46
  • Ok I see. Since the paper you linked is blocked by a paywall, it's difficult to help further. Can you elaborate on the 'value extraction method' from your question? Commented Oct 25, 2021 at 0:59
  • Just a thought since I cant view the paper, but are you trying to get some summary of each raster into the points? For example if you want the average elevation for your study area as an attribute for each point, you can use Zonal Statistics to produce a new raster. This will produce a new raster with every cell containing the same value - the average of the input raster. Then you can extract the value to all your points. Commented Oct 25, 2021 at 1:03
  • The methodology followed by the paper is not very clear to me. I think they have extracted values from the entire study area to some points. You can use this link to view the paper. Can you elaborate on how the zonal statistics tool will help in this?
    – Badal
    Commented Oct 26, 2021 at 3:07
1

The Add Surface Information tool in the 3D Analyst Toolbox will populate a point files with the underlying value from a raster. The tool is available in both ArcGIS and ArcGIS Pro. The tool requires an advanced license.

If you do not have an advanced license you can use the point sampling tool in QGIS to accomplish the same thing at no cost.

Keep in mind that these vector-raster combination tools will require that your input point data, and the input raster data share the same coordinate reference system. If not, in ArcGIS anyway, you will get the not-helpful 99999 error.

1
  • 1
    In my understanding, this tool extracts the value from the specified sampling distance to the points but does interpolation to get the data. This is not working for discrete rasters like LULC or soil texture. For lulc, all the output z values are 0 and for the soil texture, all the z values are out of range.
    – Badal
    Commented Oct 24, 2021 at 5:08

Your Answer

By clicking “Post Your Answer”, you agree to our terms of service and acknowledge you have read our privacy policy.

Not the answer you're looking for? Browse other questions tagged or ask your own question.