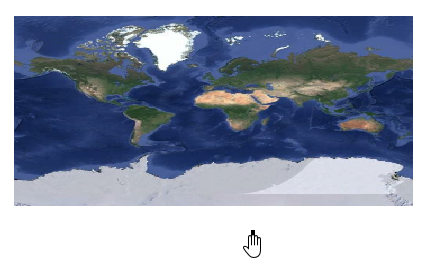
I am working with GPM Precip data on a hydrologic study and I am having a hard time figuring out why the netcdf files I downloaded are giving me issues when I try and map the data.
I am still learning rioxarray and my issues might be related to that. An example data set loads as ds using rioxarray.open_rasterio and looks like:
<xarray.Dataset>
Dimensions:           (time: 1, x: 31, y: 32)
Coordinates:
  * time              (time) object 2005-09-25 00:00:00
  * x                 (x) float64 34.15 34.25 34.35 34.45 ... 36.95 37.05 37.15
  * y                 (y) float64 -108.2 -108.3 -108.4 ... -111.1 -111.2 -111.3
    spatial_ref       int32 0
Data variables:
    precipitationCal  (time, y, x) float32 ...
Attributes: (12/50)
    lat#axis:                           Y
    lat#bounds:                         lat_bnds
    lat#DimensionNames:                 lat
    lat#fullnamepath:                   /Grid/lat
    lat#LongName:                       Latitude at the center of\n\t\t\t0.10...
    lat#origname:                       lat
    ...                                 ...
    time#DimensionNames:                time
    time#fullnamepath:                  /Grid/time
    time#LongName:                      Representative time of data in \n\t\t...
    time#origname:                      time
    time#standard_name:                 time
    time#units:                         seconds since 1970-01-01 00:00:00 UTC
To me this looks fine. I noticed the file does not have a projection, but I know it is in EPSG:4326, so I write the crs using:
ds.rio.write_crs("epsg:4326", inplace=True)
When I write the raster out to tiff using
ds.isel(time=0).rio.to_raster(r'workspace\example.tif')
The file is generated, but plots off the globe (near my hand shaped cursor).
After inspecting the output raster, I have found the x and y coordinates from the source netcdf are flipped. For my study area, y values (N-S Direction) should be like 35° and x-values (E-W direction) should be like -109°. The transform from the source netcdf is
In [50]: gt = ds.rio.transform()
In [51]: gt
Out[51]:
Affine(0.1, 0.0, 34.10000152587891,
       0.0, -0.0999999507780998, -108.20000002461094)
Based on my understanding the transform should be reordered like:
Correct_Affine = Affine(-0.0999999507780998, 0.0 ,-108.20000002461094,
                        0.0, 0.1, 34.10000152587891)
If I write a raster using Correct_Affine, the data are plotted in the correct location.
What am I missing here?

