0

I am currently working with annual forest loss raster data from Global forest watch. (https://data.globalforestwatch.org/documents/14228e6347c44f5691572169e9e107ad/explore)

Data is built up so that forest loss for each specific year (2000-2019) is given a specific value from 0 to 19. 19 = 2019 forest loss, etc.

I also have a set of polygons representing hunting areas.

Is there any way to calculate the area of each specific raster value (year) for each of my polygons.

Ex. For HuntingArea1, 150 ha forest loss in 2019, 120 ha forest loss in 2018, 80 ha loss in 2017 etc.

Hope you get what I am looking for here.

2
  • Welcome to GIS SE! We're a little different from other sites; this isn't a discussion forum but a Q&A site. Your questions should as much as possible describe not just what you want to do, but precisely what you have tried and where you are stuck trying that. Please check out our short tour for more about how the site works
    – Ian Turton
    Commented Mar 1, 2022 at 9:14
  • 1
    Sorry. I work in QGIS.
    – Erik Berg
    Commented Mar 1, 2022 at 9:23

1 Answer 1

1
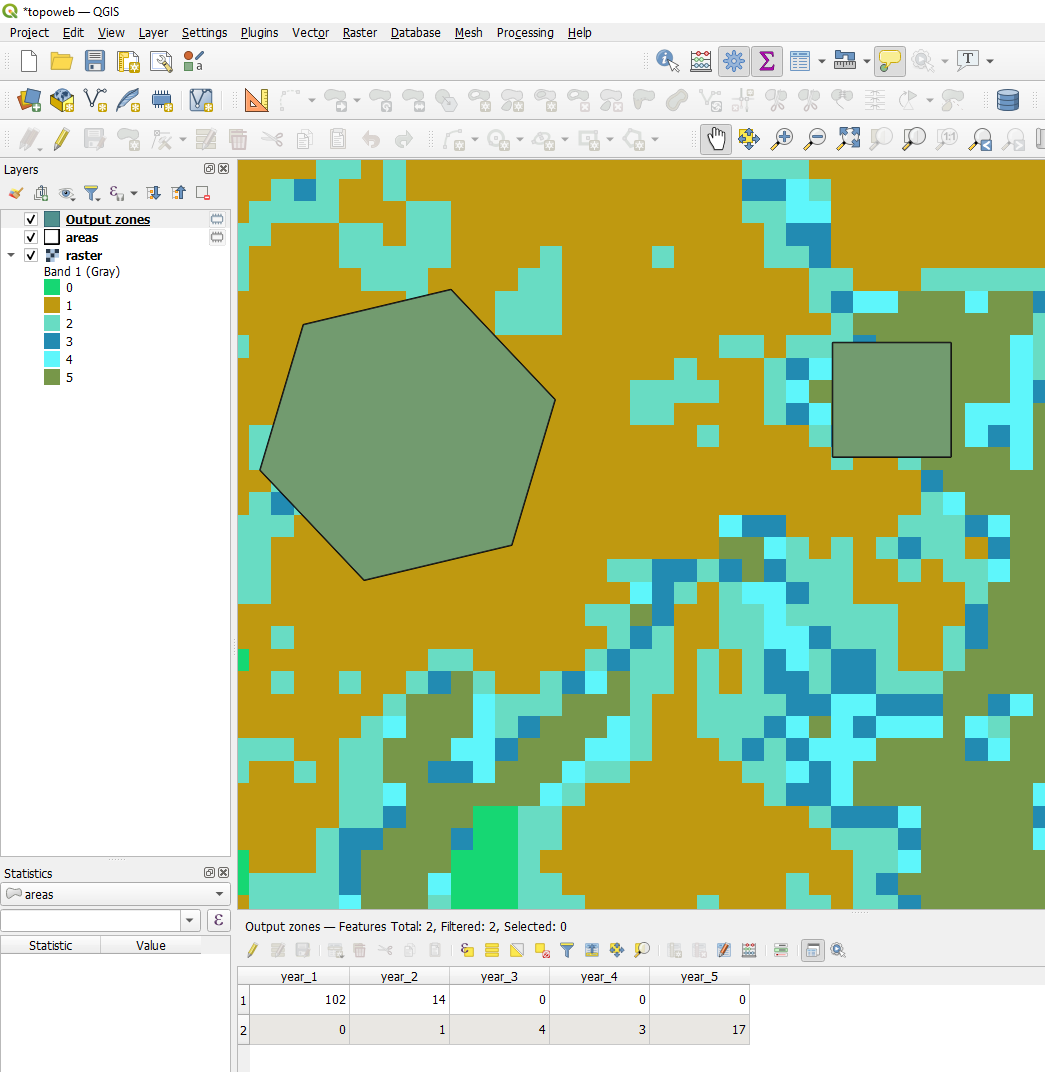
  1. Zonal histogram
  2. Multiply each output column/pixel count with the pixel size (can be found under layer properties) using Field Calcualtor or Refactor Fields

enter image description here

Your Answer

By clicking “Post Your Answer”, you agree to our terms of service and acknowledge you have read our privacy policy.

Not the answer you're looking for? Browse other questions tagged or ask your own question.