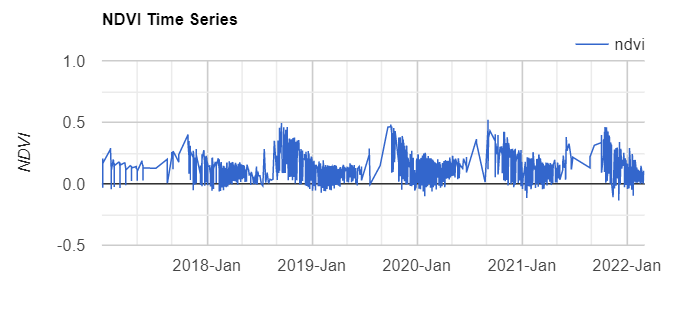
I am trying to perform Time series of my study area, for a period of 6 years, from 2016-2022 (March) using Sentinel-2 COPERNICUS/S2 dataset, in Google Earth Engine JavaScript Web API.
This is how my current implementation shows:

I want to make it look more understandable visually. How can I do that?
// Load Dataset; From -> 01-ImageCollection
var s2 = ee.ImageCollection("COPERNICUS/S2");

// Specify ROI; From -> 00-FeatureCollection-Part1
var geometry = ee.Geometry.Polygon([[
  [72.83750127696464, 19.235402686119595],
          [72.83750127696464, 18.95509397610801],
          [73.11749530133126, 18.95509397610801],
          [73.11749530133126, 19.235402686119595]
]]);

//Adding to Map Layer
Map.addLayer(geometry, {color: 'red'}, 'ThaneCreek')
Map.centerObject(geometry)
var rgbVis = {min: 0.0, max: 3000, bands: ['B4', 'B3', 'B2']};


//Filter Dataset as per requirement; From-> 02-Filter_ImageCollection
var filtered = s2
  .filter(ee.Filter.date('2017-01-01', '2022-03-01'))
  .filter(ee.Filter.lt('CLOUDY_PIXEL_PERCENTAGE', 30))
  .filter(ee.Filter.bounds(geometry))

// Write a function for Cloud masking
function maskS2clouds(image) {
  var qa = image.select('QA60')
  var cloudBitMask = 1 << 10;
  var cirrusBitMask = 1 << 11;
  var mask = qa.bitwiseAnd(cloudBitMask).eq(0).and(
             qa.bitwiseAnd(cirrusBitMask).eq(0))
  return image.updateMask(mask)//.divide(10000)
      .select("B.*")
      .copyProperties(image, ["system:time_start"])
}

var filtered = filtered.map(maskS2clouds)

//Write NDVI function; From->06-ComputationOnImageCollection
function addNDVI(image) {
  var ndvi = image.normalizedDifference(['B8', 'B4']).rename('ndvi');
  return image.addBands(ndvi);
}

// Map the function over the collection
var withNdvi = filtered.map(addNDVI);

//Chart display
// Display a time-series chart
// Reducer -> 07-Reducer
var chart = ui.Chart.image.series({
  imageCollection: withNdvi.select('ndvi'),
  region: geometry,
  reducer: ee.Reducer.mean(),
  scale: 20
}).setOptions({
      lineWidth: 1,
      title: 'NDVI Time Series',
      interpolateNulls: true,
      vAxis: {title: 'NDVI'},
      hAxis: {title: '', format: 'YYYY-MMM'}
    })
print(chart);
Here is my code
