2

I have a population raster (from Worldpop.org) with data on the population count of Philippines. It is unconstrained data from 2020, 100m resolution.

Link to raster: https://www.worldpop.org/geodata/summary?id=28283

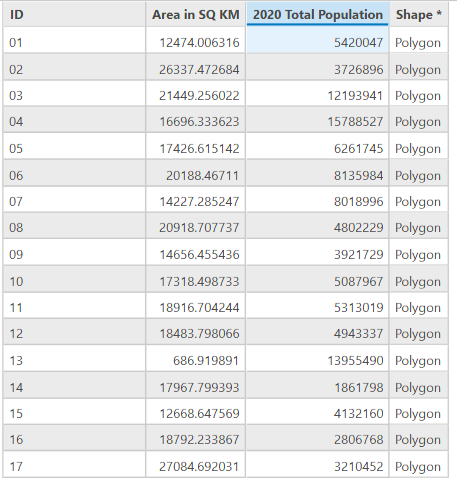
I also obtained polygons of the 17 regions of Philippines from the Living Atlas (https://esri.maps.arcgis.com/home/item.html?id=06c1e6777d53415eb181566f471df2f3). This is how the regional data looks like. I've converted the polygons into rasters (using the Polygon to Raster tool in ARCGIS) for the purpose of my analysis and also made sure they have same dimensions as the population raster using the resample function.

enter image description here

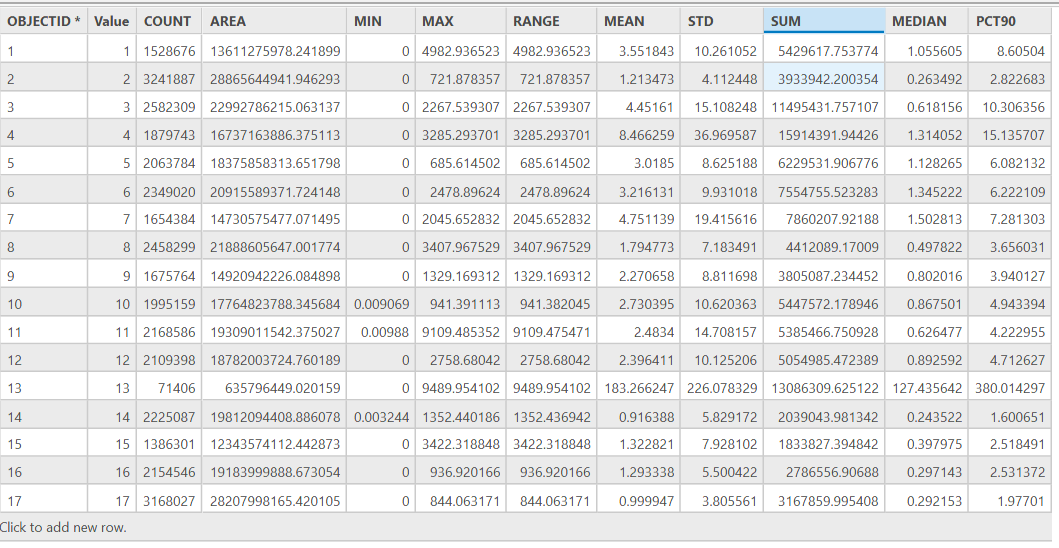
I used zonal statistics as table with input value raster as the population raster and feature zone data as the regional raster. The output gives me what I want - which is the population raster divided into 17 regions.

enter image description here

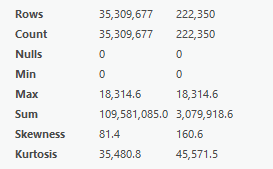
But unfortunately, the sum within each region does not match the regional population from the previous image. Furthermore, the sum of all the pixels (before applying zonal statistics) was 109 million but after this process, it reduced to 105 million - this is surprising since the overall population should remain the same.

I am guessing there is some data loss here but how do I overcome it?

2

1 Answer 1

0

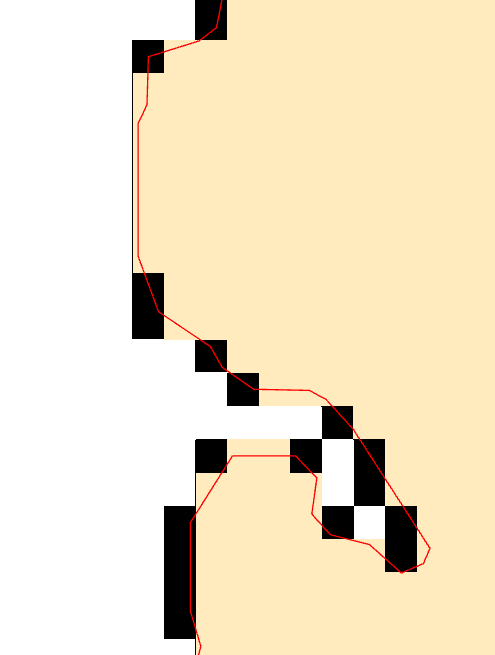
I have experimented with the data and the "3 million missing people" can be entirely explained by the fact that the raster version of your boundaries does not entirely match the worldpop data.

In the image below the yellow pixels are the result of converting the polygons into a raster mask, the black pixels are the worldpop pixels and as you can clearly see not every worldpop pixel is covered by the mask, because you can see them!

Data

Now it turns out that if you add up all the pixels that are not covered by the mask and therefore not used in the zonal stats tool this comes out at ~ 3million

Stats

That's the reason why there is such a disparity in numbers. Interesting number, you could say 3 million people are at risk of sea level rise by virtue of their proximity to the coastline although that does not take into account elevation.

2
  • Wow! Thank you so much for this detailed explanation. Very much appreciate it for showing me where the discrepancy is! Do you have any suggestions to work around this problem and to account for the 3 million people when I split the population raster into regions? I am thinking convert the regions raster into lines instead... Commented May 28, 2022 at 1:47
  • You need to come up with some clever approach to grow your regions out to cover worldpop. You might want to consider some sort of Euclidean distance or converting to vector and back.
    – Hornbydd
    Commented May 28, 2022 at 8:31

Your Answer

By clicking “Post Your Answer”, you agree to our terms of service and acknowledge you have read our privacy policy.

Not the answer you're looking for? Browse other questions tagged or ask your own question.