0

I want to create boxplot to show Forest Percent by localunit (GaPa_NaPa). The attribute data is as shown below:- enter image description here
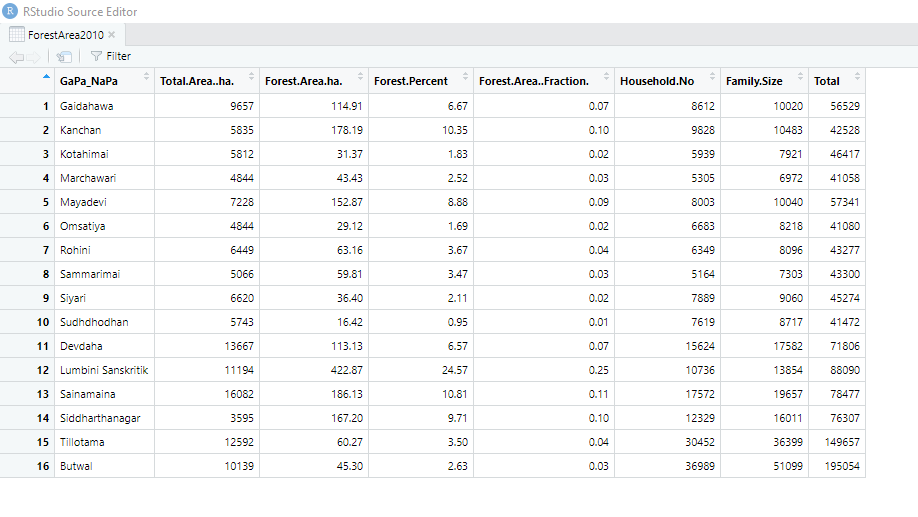
The data frame is as shown below:-

structure(list(GaPa_NaPa = c("Gaidahawa", "Kanchan", "Kotahimai", 
"Marchawari", "Mayadevi", "Omsatiya", "Rohini", "Sammarimai", 
"Siyari", "Sudhdhodhan", "Devdaha", "Lumbini Sanskritik", "Sainamaina", 
"Siddharthanagar", "Tillotama"), Total.Area..ha. = c(9657L, 5835L, 
5812L, 4844L, 7228L, 4844L, 6449L, 5066L, 6620L, 5743L, 13667L, 
11194L, 16082L, 3595L, 12592L), Forest.Area.ha. = c(114.91, 178.19, 
31.37, 43.43, 152.87, 29.12, 63.16, 59.81, 36.4, 16.42, 113.13, 
422.87, 186.13, 167.2, 60.27), Forest.Percent = c(6.67, 10.35, 
1.83, 2.52, 8.88, 1.69, 3.67, 3.47, 2.11, 0.95, 6.57, 24.57, 
10.81, 9.71, 3.5), Forest.Area..Fraction. = c(0.07, 0.1, 0.02, 
0.03, 0.09, 0.02, 0.04, 0.03, 0.02, 0.01, 0.07, 0.25, 0.11, 0.1, 
0.04), Household.No = c(8612L, 9828L, 5939L, 5305L, 8003L, 6683L, 
6349L, 5164L, 7889L, 7619L, 15624L, 10736L, 17572L, 12329L, 30452L
), Family.Size = c(10020L, 10483L, 7921L, 6972L, 10040L, 8218L, 
8096L, 7303L, 9060L, 8717L, 17582L, 13854L, 19657L, 16011L, 36399L
), Total = c(56529L, 42528L, 46417L, 41058L, 57341L, 41080L, 
43277L, 43300L, 45274L, 41472L, 71806L, 88090L, 78477L, 76307L, 
149657L)), row.names = c(NA, 15L), class = "data.frame")

The code I am using is:-

setwd("C:/Users/lenovo/Desktop/AllAboutR/AssignmentDocs")
ForestArea2010<-read.csv("Forest2010.csv")
View(ForestArea2010)
boxplot(RupandehiForest2010$Forest.Percent, main= "Total Forest Percent 
in LanduseLandcover 2010", ylab="ForestPercent", ylim=c(0,10), las=1, 
col=c("green"))

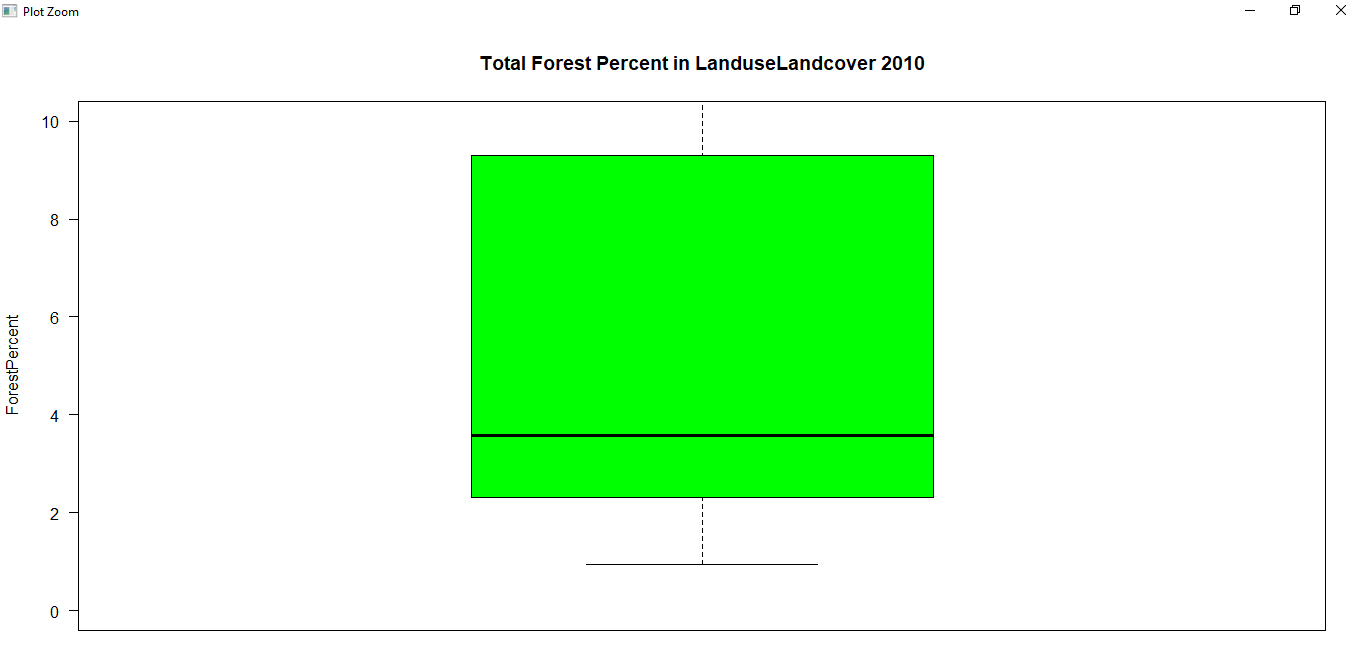
The result displayed is:- enter image description here

But, now I want to create a boxplot for selecting local unit (i.e. GaPa_NaPa column above) whose Forest Percent is greater than equal to 10% (i.e. Kanchan, Lumbini Sanskritik, Sainamani local unit) based on mean value of Forest. Percent using above attribute table. Is that possible? How can these be solved?

6
  • Please, first clean your code.
    – aldo_tapia
    Commented Jun 20, 2022 at 13:11
  • Not yet, no need to include install.packages commands or cartography library
    – aldo_tapia
    Commented Jun 20, 2022 at 13:21
  • Please try and make simplified examples that we can all run. Remove all libraries that aren't necessary. Use commonly-available or make data sets that show the problem. I do try and answer most of your questions but every time I see one my first thought is "Okay, first I have to make some data...". Please help us to help you.
    – Spacedman
    Commented Jun 20, 2022 at 13:22
  • @aldo_tapia, I have simplified my code as per your suggestion.
    – Walker
    Commented Jun 20, 2022 at 14:11
  • You've not made it any better - now there are no packages specified, so we don't know what packages we do really need for this example. Also we still don't have sample data. The ideal question is one where the code you show can be cut-and-pasted into a clean R session by another user and they should get the same output as you.
    – Spacedman
    Commented Jun 20, 2022 at 14:51

1 Answer 1

1

Taking a vector and subsetting it by a condition will return those values that match the condition. You seem to want to make a boxplot of:

RupandehiForest2010$Forest.Percent[RupandehiForest2010$Forest.Percent>=10]

values. In its simplest form:

boxplot(RupandehiForest2010$Forest.Percent[RupandehiForest2010$Forest.Percent>=10])

Set other parameters as you want for style etc.

This is not really a GIS question (its a basic R programming question, if I've understood correctly) so you should probably read a good R introduction to understand the basics like this and ask non-GIS questions on http://stackoverflow.com when you get stuck - but come back here for anything GIS, spatial and map-related.

Your Answer

By clicking “Post Your Answer”, you agree to our terms of service and acknowledge you have read our privacy policy.

Not the answer you're looking for? Browse other questions tagged or ask your own question.