10

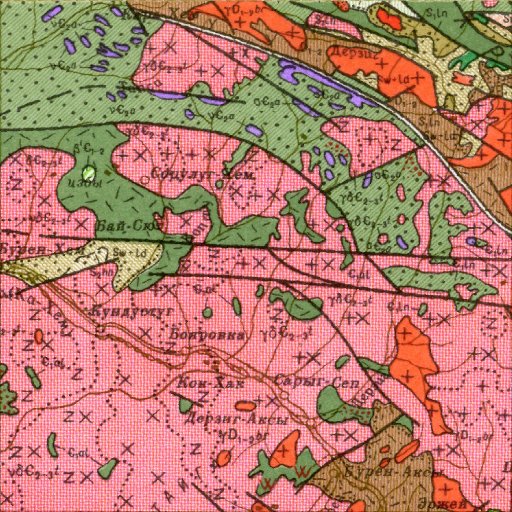
I'd like to make use of a geological map as shown in the example below, which is only a pretty small and downsized part of the map, so editing/redrawing doesn't seem to make sense in the end.

My idea would be to have it first converted to vector with only bedrock and tectonic faults left, thereafter having the possibility to optionally use a "cleaned" raster file.

Any hints on a "how to do?"

bedrock map

7
  • 2
    Could you provide a key or otherwise describe how to identify the bedrock and tectonic faults? (There are an awful lot of features shown here: I discern at least five types of line symbols, for instance, along with many types of hashing and point symbols that could easily be confused with short linear features.)
    – whuber
    Commented Dec 10, 2012 at 20:31
  • 1
    I'd love to be proved wrong, but I don't think there is a simple way of doing this. I guess this is an RGB scan? If the outlines of the shapes and the fault lines were all a perfect black (RGB 0,0,0) you'd stand more of a chance, but they won't be. If it's any consolation I've spent this morning trying to get "black" lines out of a geological raster image and this afternoon tracing them as vectors. My suggestion would be to get the image into an image editor, adjust its colours and then get tracing. N.
    – nhopton
    Commented Dec 10, 2012 at 20:34
  • Try a supervised classification (with SAGA or GRASS), then use a filter like "sieve" or "majority" and vectorize the result. I guess the parallelepiped algorithm (SAGA) should be the best for the classification.
    – MartinMap
    Commented Dec 10, 2012 at 21:05
  • 1
    @whuber: to me most important are the "thick-black" lines which represent tectonic faults. Second is bedrock respresented by color (but hell, wanna get rid of handdrawn symbols!) within their outline. I do not bother about "x", "zx", "+x",... this would get tooo detailled! So from given example, for me it would be sufficient, to get.... - bold black lines - 1-color polygones (shlash != dot) Commented Dec 10, 2012 at 21:54
  • @nhopton yes, it's an RGB scan. As you suggest the borders and fault lines are not perfect at all. Tries of vectorising oder using Gimp ended in dividing Polygones, not lines :-( I've "played" a lot with Gimp, bt it doesnt seam to help. Best way to start so far seams to be a b/w conversion and then trying to get things into the right direction :-( Commented Dec 10, 2012 at 21:59

4 Answers 4

2

There is no need to clean a map to vectorize it. Printed raster maps have resolutions, scales. Editing and redrawing make much sense since you planning create a new map composition using data from another map source.

If you do not have the original data used to create the map or if it is old and need be converted to digital format( raster, vector ) then the best solution is hand(manual) vectorizing.

Since maps usually are composition of several data sources it is hard to find a pattern to be used by software to recreate the source data. Automated or semi automated process do exists for one color maps but the results are not so good like human maded digitized maps.

You may need to tile the raster to split work into zones. This will also enable you to pipeline pieces with several people to do it on same time if you sohrt in time.

Topological editing simplify the creation of vector data since it reduces the change of digiting error on output data.

Vector format have so benefits over the original raster map

  1. It does not have a fixed resolution.
  2. It can reduce the data size to store on memory.
  3. It can de easily redraw/filtered/converted back to a raster.
1

While not an open source or QGIS utility, ArcGIS does have the ArcScan extension that can be used to help vectorize features from raster maps. ArcScan, of course, works best with 2 color images and hard edges, so I'm uncertain how the multicolor raster you showed would work. While it is not perfect, it may be another potential option.

Starting with the release of ArcGIS 10.1, ArcScan for ArcGIS is included in all license levels of ArcGIS for Desktop software at no additional cost.

Of course, as @Peter Ivan suggested, you could always turn to a 3rd party vendors, like Amazon Mechnical Turk (see more generic details as described by wikipedia), to digitize the data for you.

0

I know it´s probably too late now... but: try to edit the raster using gimp and creating an image with just black, red, pink, green, blue, ... "clean" the color channels (for example delete the text and symbols stuff from the "black" channel with the faultlines) then try vectorizing again. maybe even the single colors for themselves and combining them again afterwards

-1

There are people (teams, companies) who do vectorisation by hand. It takes some time to do it, depending on the amount of "paper".
You usually vectorise borders and points/texts. After an initial vectorisation it's much easier to improve the drawing and categorize the features.

Your Answer

By clicking “Post Your Answer”, you agree to our terms of service and acknowledge you have read our privacy policy.

Not the answer you're looking for? Browse other questions tagged or ask your own question.