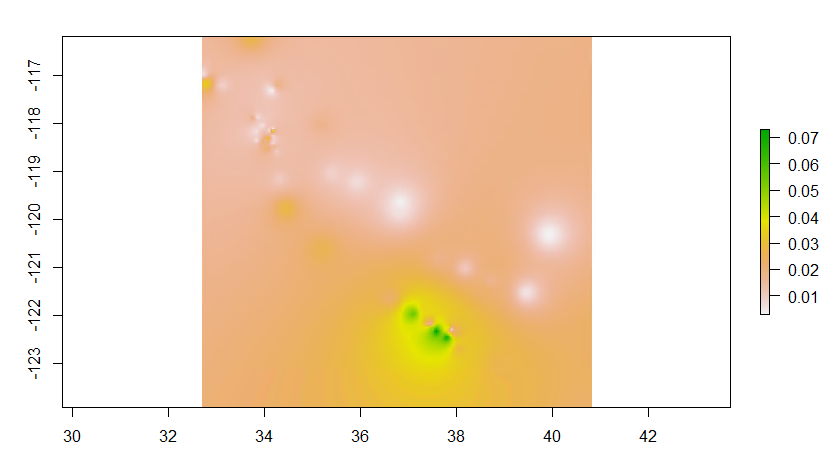
I've produced a raster using IDW to make predictions across California, and now I'm trying to overlay the raster image with the border/shapefile of California.
I've ensured the CRS projections are the same for both plots, however I still can't get both to show up.
The following is the code for how I produced the raster:
x.range <- as.double(range(zip_table@coords[,1]))
y.range <- as.double(range(zip_table@coords[,2]))

grd <- expand.grid(x=seq(from=x.range[1], to=x.range[2], by=0.01),
                   y=seq(from=y.range[1], to=y.range[2], by=0.01))

## convert grid to SpatialPixel class
coordinates(grd) <- ~ x + y
gridded(grd) <- TRUE

idw1 <- gstat::idw(TELERATIO ~ 1, zip_table, grd, idp = 2)

idw.output <- as.data.frame(idw1)
names(idw.output)[1:3] <- c("lng","lat","var1.pred")

r <- raster(idw1)```
And the CA state file I downloaded using a work around of the raster::getData function:
CA <- gadm36_USA_1_sp[gadm36_USA_1_sp$NAME_1 =='California',]
When I produce my plots, only the raster shows up:
plot(CA, add = TRUE)

