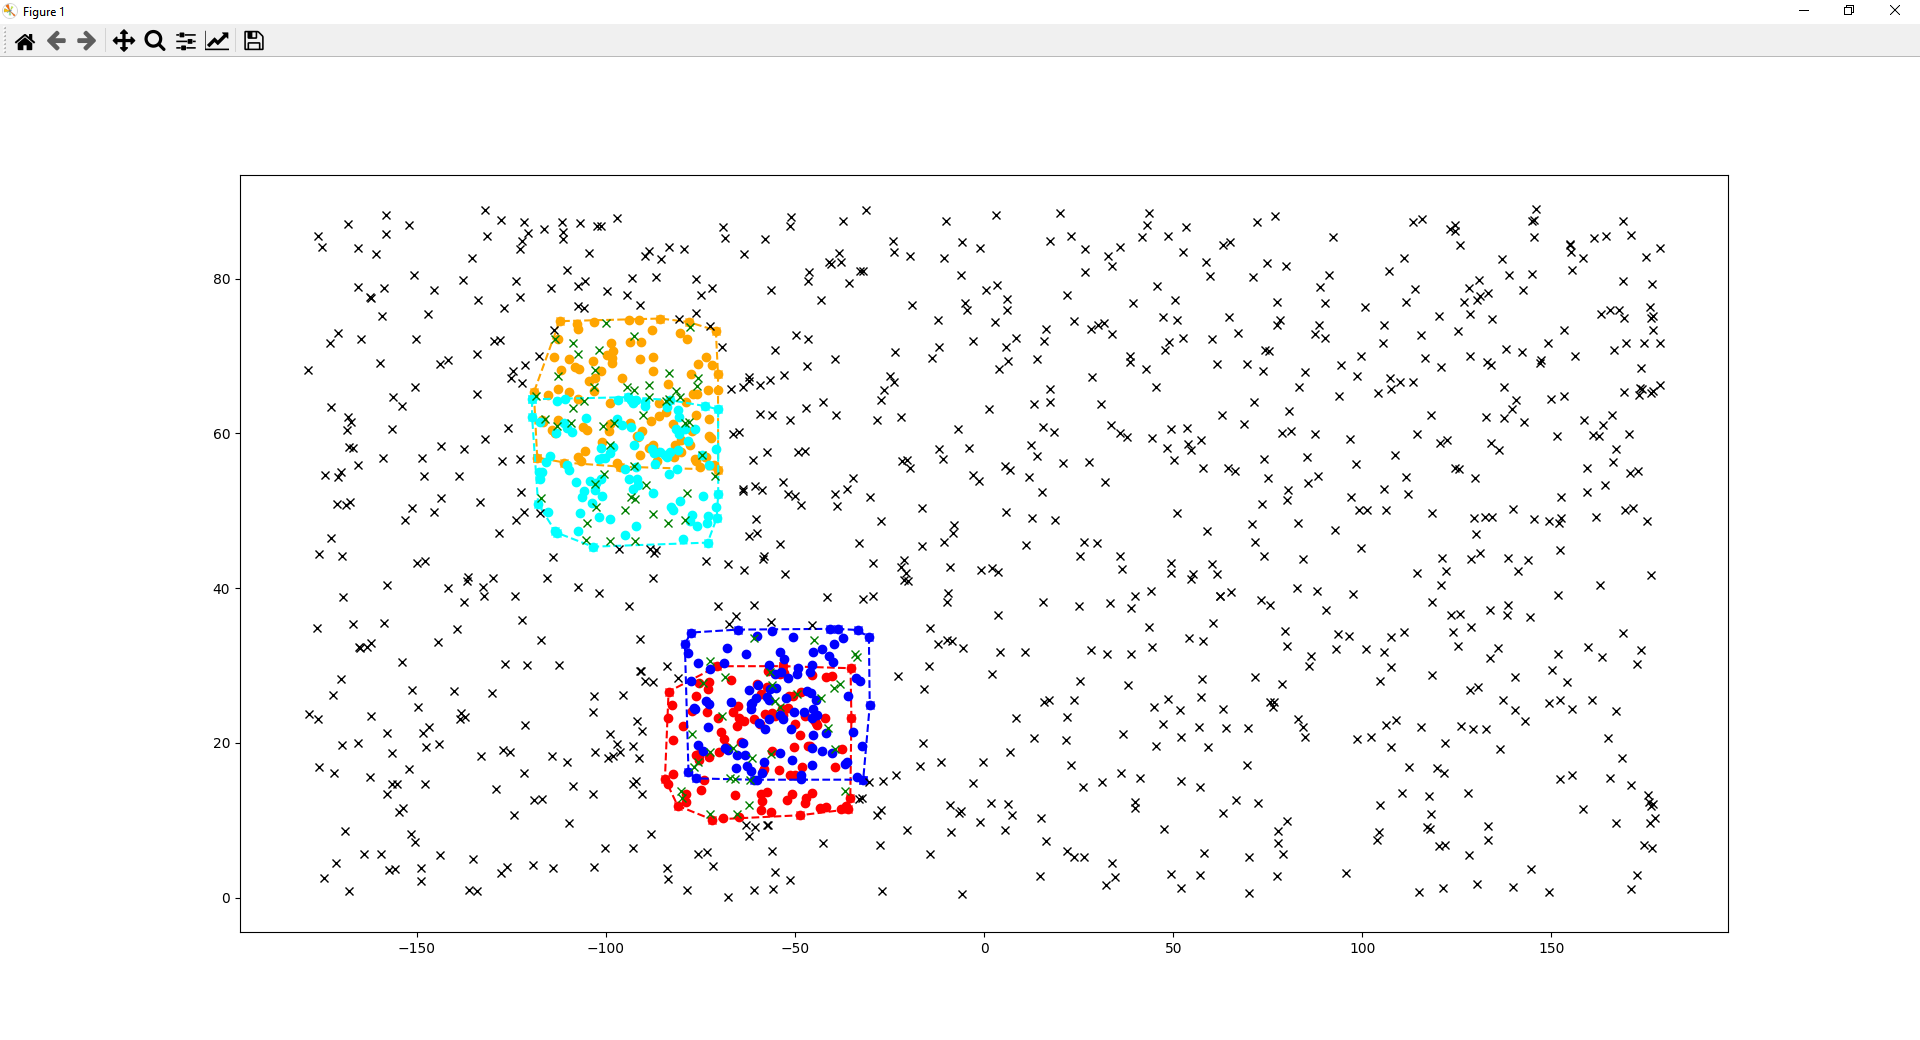
Here is a possible solution using shapely.
It generates a shapely Polygon for each cluster hull.
Then, it checks each point in a given dataframe (df1) is within at least one of the hulls.
Plots shows the cluster points (red/blue/orange/cyan), the cluster hulls (dashed lines, same colors), the datapoints to test in black (out of cluster hull) and green (inside cluster hull).
Modules versions:
Python 3.9.13 (tags/v3.9.13:6de2ca5, May 17 2022, 16:36:42) [MSC v.1929 64 bit (AMD64)]

pandas 1.4.1
shapely 1.7.1
numpy 1.22.3
matplotlib 3.5.1
scipy 1.8.1
Matplotlib:

import sys
from typing import List

import matplotlib
import numpy as np
import pandas as pd
import scipy
import shapely
from matplotlib import pyplot as plt
from scipy.spatial import ConvexHull
from shapely.geometry import Point, Polygon

print("Python", sys.version)
for m in [pd, shapely, np, matplotlib, scipy]:
    print(m.__name__, m.__version__)


def generate_random(n: int,
                    low_lat: int, high_lat: int,
                    low_lon: int, high_lon: int,
                    cluster_id: int):
    cols = ["latitude", "longitude"]
    if cluster_id:
        cols.append("cluster")
    df = pd.DataFrame(columns=cols)
    df.latitude = np.random.uniform(low=low_lat, high=high_lat, size=(n,))
    df.longitude = np.random.uniform(low=low_lon, high=high_lon, size=(n,))
    if cluster_id:
        df.cluster = cluster_id
    return df


def coords_to_shapely_point(x: np.ndarray, y: np.ndarray) -> List[Point]:
    return list(map(Point, x.tolist(), y.tolist()))


def generate_random_inputs():
    nb_clusters_to_generate = 4
    df_clusterrs = []
    for i in range(nb_clusters_to_generate):
        lat_offset = int(np.random.choice(a=[-25, -20, -15, 15, 20, 25], size=(1,)))
        lon_offset = int(np.random.choice(a=[-25, -20, -15, 15, 20, 25], size=(1,)))
        df_clutser_i = generate_random(n=100, cluster_id=i + 1,  # stort from 1, 0 = no cluster
                                       low_lat=30 + lat_offset, high_lat=50 + lat_offset,
                                       low_lon=-100 + lon_offset, high_lon=-50 + lon_offset)
        df_clusterrs.append(df_clutser_i)
    df = pd.concat(df_clusterrs)
    df1 = generate_random(n=1000, cluster_id=0, low_lat=0, high_lat=89, low_lon=-179, high_lon=180)
    return df, df1


df, df1 = generate_random_inputs()

cluster_geoms = []
for color, cluster_id in zip(["red", "blue", "orange", "cyan"],
                             df.cluster.unique().tolist()):
    dfq = df[df["cluster"] == cluster_id]
    df_cluster_coords = dfq[["latitude", "longitude"]]
    Y = df_cluster_coords.to_numpy()
    # plot cluster data
    plt.plot(Y[:, 1], Y[:, 0], 'o', color=color)
    # compute hull
    hull = ConvexHull(Y)
    # hull.vertices gives indexes of the hull points
    hull_vertices = df_cluster_coords.iloc[hull.vertices].to_numpy()
    _hull_X = hull_vertices[:, 1]
    _hull_Y = hull_vertices[:, 0]
    # close shape
    _hull_X = np.append(_hull_X, _hull_X[0])
    _hull_Y = np.append(_hull_Y, _hull_Y[0])
    plt.plot(_hull_X, _hull_Y, "x", color=color, ls="--")
    cluster_geoms.append(Polygon(coords_to_shapely_point(x=_hull_X, y=_hull_Y)))


def is_in_clusters(row, clusters: List[Polygon]) -> bool:
    p = Point(row.longitude, row.latitude)
    is_in_cluster = False
    for c_geom in clusters:
        is_in_cluster |= c_geom.contains(p)
    return is_in_cluster


df1["in_cluster"] = df1.apply(is_in_clusters, axis=1, clusters=cluster_geoms)

for latitude, longitude, in_cluster in df1.itertuples(index=False):
    plt.plot(longitude, latitude, "x", color="green" if in_cluster else "black")
plt.show()

