4

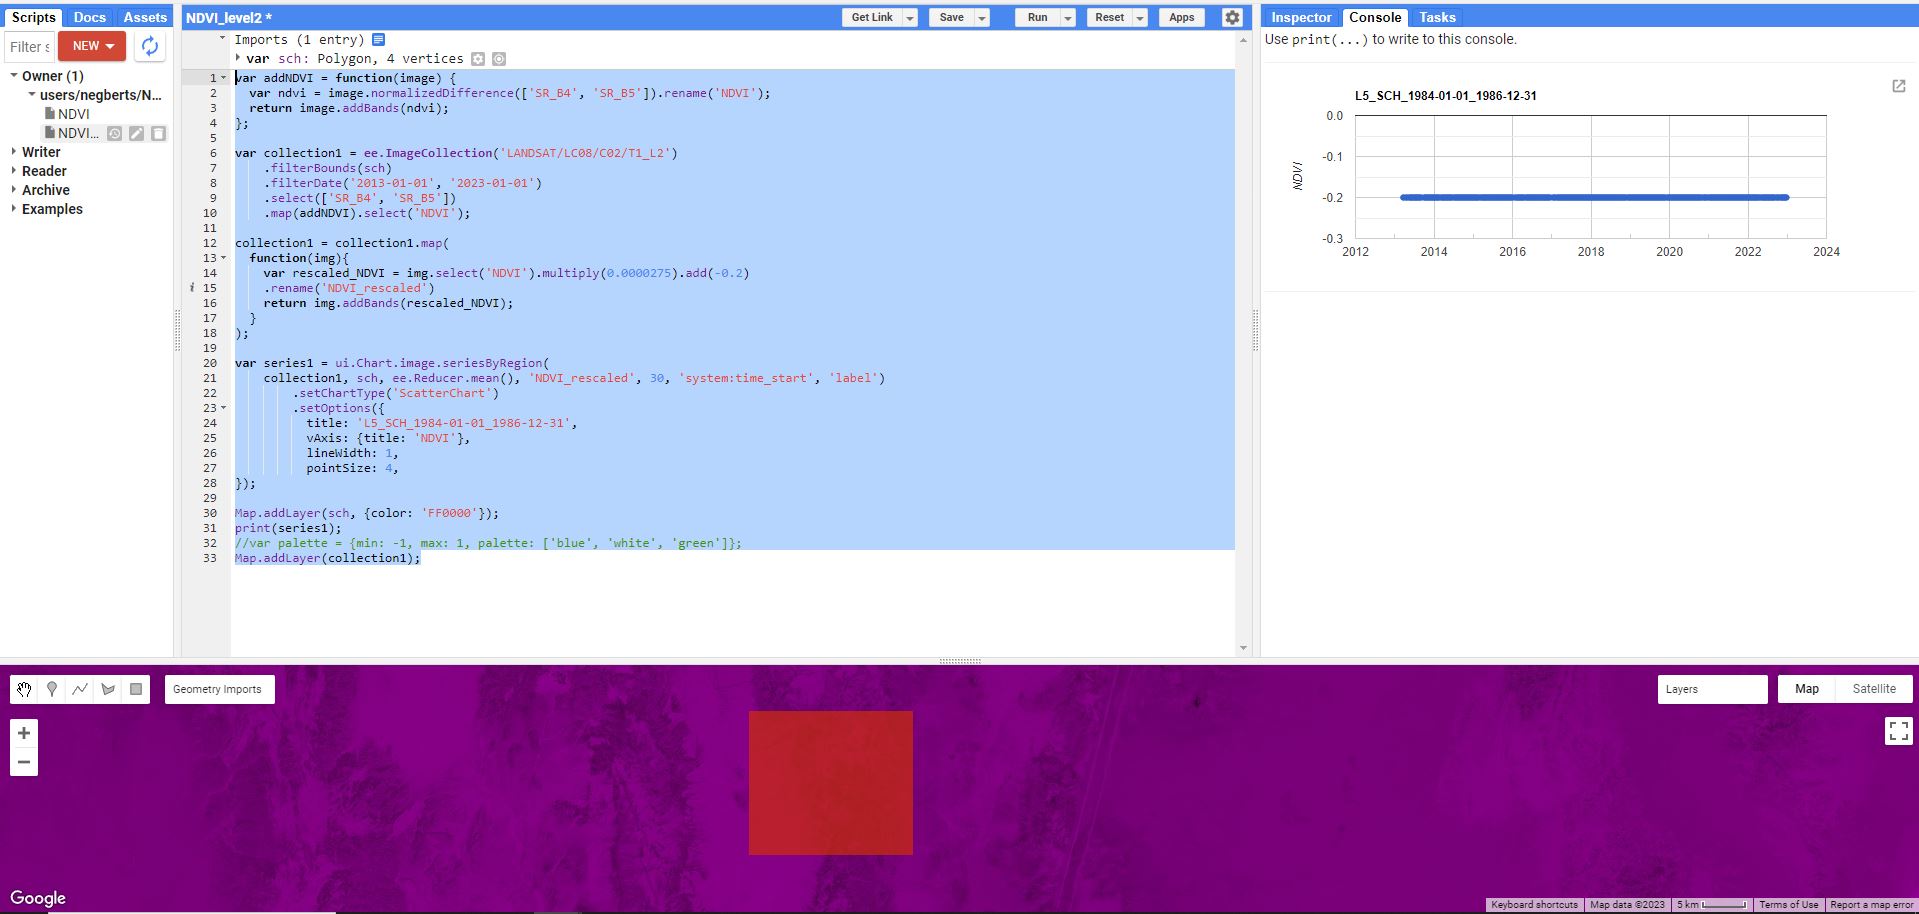
After applying a scaling factor to my LANDSAT collection 2 level 2 data the values seem to be off.

screen capture of code and output

var addNDVI = function(image) {
      var ndvi = image.normalizedDifference(['SR_B4', 'SR_B5']).rename('NDVI');
      return image.addBands(ndvi);
    };


var collection1 = ee.ImageCollection('LANDSAT/LC08/C02/T1_L2')
    .filterBounds(sch)
    .filterDate('2013-01-01', '2023-01-01')
    .select(['SR_B4', 'SR_B5'])
    .map(addNDVI).select('NDVI');

collection1 = collection1.map(
  function(img){
    var rescaled_NDVI = img.select('NDVI').multiply(0.0000275).add(-0.2)
    .rename('NDVI_rescaled')
    return img.addBands(rescaled_NDVI);
  }
);
  
var series1 = ui.Chart.image.seriesByRegion(
    collection1, sch, ee.Reducer.mean(), 'NDVI_rescaled', 30, 'system:time_start', 'label')
        .setChartType('ScatterChart')
        .setOptions({
          title: 'L5_SCH_1984-01-01_1986-12-31',
          vAxis: {title: 'NDVI'},
          lineWidth: 1,
          pointSize: 4,
});

Map.addLayer(sch, {color: 'FF0000'});
print(series1);
//var palette = {min: -1, max: 1, palette: ['blue', 'white', 'green']};
Map.addLayer(collection1);
9
  • How do you want the chart to look? 0.0000275 is very small value to multiply. Commented Feb 1, 2023 at 9:51
  • @KadirŞahbaz I am very new to this, I assumed mostly positive values in the range of 0.2-0.8.
    – N_LLC
    Commented Feb 1, 2023 at 9:53
  • NDVI range is [-1, 1]. -1*0.0000275-0.2 = -0.20000275 and 1*0.0000275-0.2 = -0.1999725. So NDVI_rescaled range would be [-0.20000275, -0.1999725]. You need to define proper number to multiply and add. Commented Feb 1, 2023 at 10:01
  • But these are the official rescaling factors from the LANDSAT website
    – N_LLC
    Commented Feb 1, 2023 at 10:05
  • 1
    According to the chart, you seem to be getting a constant value. But it is not. To limit the axis, add viewWindow: {min: -0.20001, max: -0.19999} into vAxis option. Result -> i.sstatic.net/YqprG.png Commented Feb 1, 2023 at 11:26

1 Answer 1

5

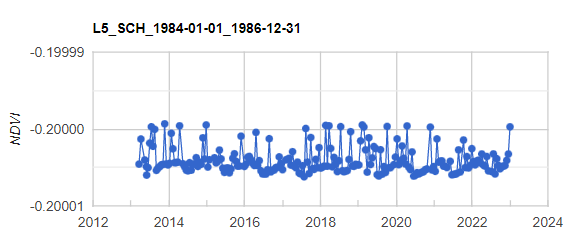
According to the chart, you seem to be getting a constant value. But that's not true. If you limit the axis, you will see the result clearly. To limit the axis, add viewWindow: {min: -0.20001, max: -0.19999} into vAxis option.

    .setOptions({
      title: 'L5_SCH_1984-01-01_1986-12-31',
      vAxis: {title: 'NDVI', viewWindow: {min: -0.20001, max: -0.19999}}, //HERE
      lineWidth: 1,
      pointSize: 4,

Result:

enter image description here


Old answer:
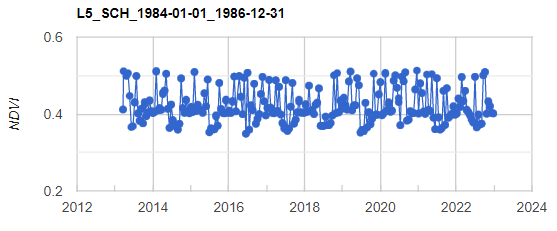
If you want to scale ndvi values [-1, 1] to, for example, [0, 1], use ndvi * 0.5 + 0.5.

var rescaled_NDVI = img.select('NDVI').multiply(0.5).add(0.5)

The result of the line above:

enter image description here


To scale a range [min, max] to [a, b] use this formula:

(b - a)(x - min)
----------------- + a
    max - min

The result for conversion [-1, 1] to [0, 1] is ndvi * 0.5 + 0.5. Rescaling formula and additional explanation can be found here.

6
  • If I understand you correctly, I would use the rescaling factor before computing the NDVI?
    – N_LLC
    Commented Feb 1, 2023 at 10:26
  • No, after computing the NDVI. Commented Feb 1, 2023 at 10:27
  • developers.google.com/earth-engine/tutorials/community/… In the example you find here they apply the rescaling before computing the NDVI
    – N_LLC
    Commented Feb 1, 2023 at 10:30
  • You said you wanted mostly positive values in the range of 0.2-0.8. Let's say 0-1. I've edited the answer. Commented Feb 1, 2023 at 10:50
  • No, I was expecting values in that range. When I found out the values were off I assumed that I had to apply a rescaling factor as is described in this table: usgs.gov/faqs/…
    – N_LLC
    Commented Feb 1, 2023 at 11:14

Your Answer

By clicking “Post Your Answer”, you agree to our terms of service and acknowledge you have read our privacy policy.

Not the answer you're looking for? Browse other questions tagged or ask your own question.