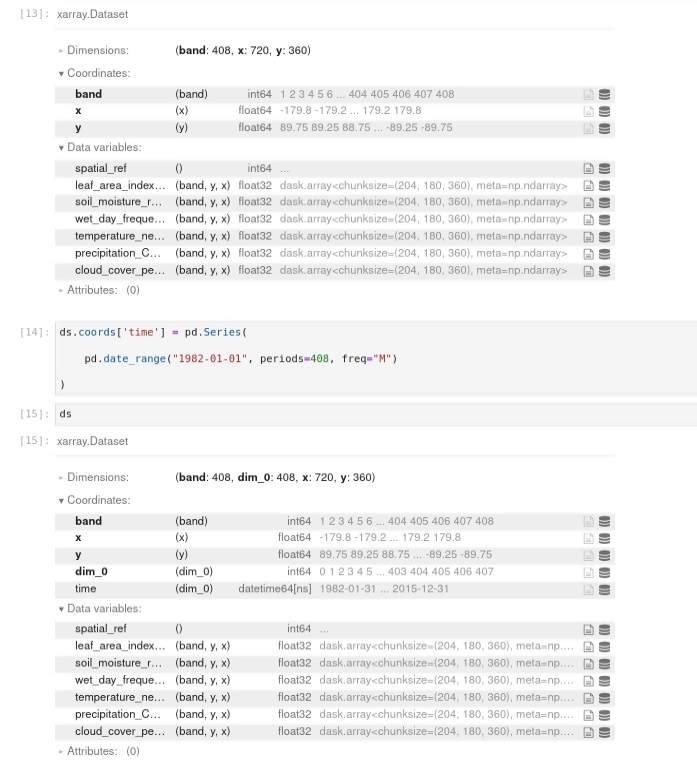
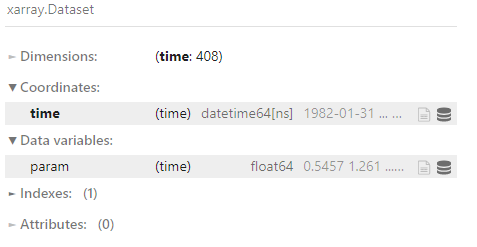
I have a netCDF which is loaded in xarray with a dimension named bands (it was originally an import via rioxarray of ENVI data), but actually, I want to be able to parse the data by time. I have tried this:
And indeed is created a "time" coordinate in the dataset, but is kind of useless when I try to parse the data as such:
ds.sel(time="1982-01-31")['leafleaf_area_index_GLASS'].where(ds.leaf_area_index_GLASS > 20).plot()
Any suggestions on how can I make this time coordinate to work? I'm not sure if there is an import option with xarray in which I could map directly the band into a datetime coordinate.


