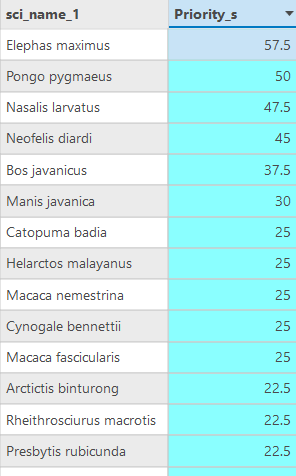
Basically, I have my IUCN species distribution layers. I initially created a heat map with overlapping polygons (Count overlapping polygons tool) but that just gives me the species richness. I thought to make the results more robust by assigning priority scores to each species and create a 'heatmap' where it counts overlapping layers based on the priority scores added together. Is there a way to do this?
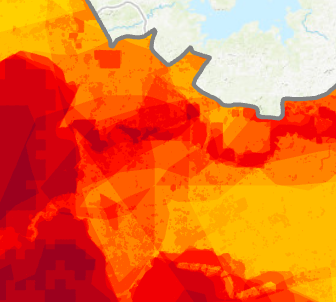
This is the output from using the count overlap polygons tool:
I want something similar to this but based off the sum of this value field. So the higher the sum of priority scores as each species layer overlaps with one another, the higher the conservation priority of the area will be.

