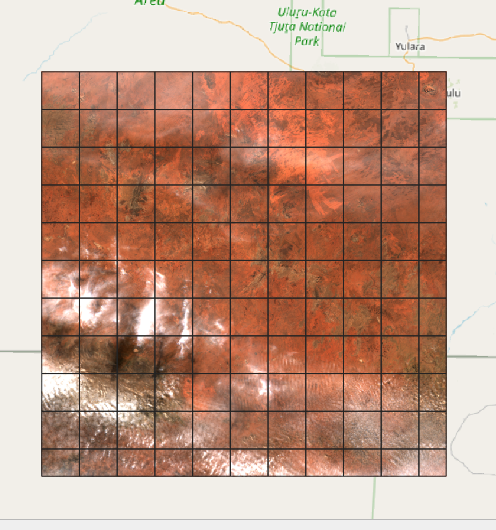
If you just want to find out the internal tiling structure i.e the blocks, you can use GDAL or rasterio commandline tools:
gdalinfo /vsicurl/https://sentinel-cogs.s3.us-west-2.amazonaws.com/sentinel-s2-l2a-cogs/52/J/FS/2023/5/S2A_52JFS_20230501_0_L2A/TCI.tif

<snip...>
Band 1 Block=1024x1024
<snip...>

rio info https://sentinel-cogs.s3.us-west-2.amazonaws.com/sentinel-s2-l2a-cogs/52/J/FS/2023/5/S2A_52JFS_20230501_0_L2A/TCI.tif

{"blockxsize": 1024, "blockysize": 1024, <snip...>
If you want to visualise the blocks, you can use rasterio.DatasetReader.block_windows to access block window offsets and rasterio.windows.bounds to convert the windows to coordinates. Then make geometry from them if you wish, e.g.
import geopandas as gpd
import rasterio as rio
from rasterio.windows import bounds
from shapely.geometry import box


tif = r"https://sentinel-cogs.s3.us-west-2.amazonaws.com/sentinel-s2-l2a-cogs/52/J/FS/2023/5/S2A_52JFS_20230501_0_L2A/TCI.tif"

with rio.open(tif) as src:
    features = {"id": [], "geometry": []}
    for id, (block_index, window) in enumerate(src.block_windows(1)):
        features["id"].append(id)
        features["geometry"].append(box(*bounds(window, src.transform)))

    gdf = gpd.GeoDataFrame(features, crs=src.crs)


