2

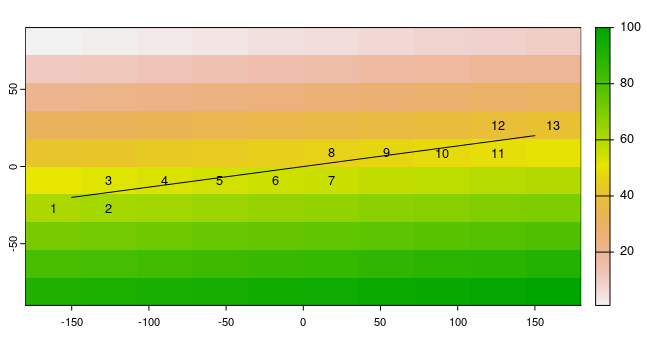
The terra::extract function samples raster data from the top to the bottom and from left to right. This creates an issue if you're using a line to sample a raster with plan of plotting the data as a cross section. And I think the issue only occurs if the line is sloping top-right to bottom-left. And the issue is more pronounced the lower the slope of the line.

Below is a reproducible example of the problem. Any suggestions on fixes? I believe the raster package as well as the exactextractr packages have similar problems so maybe there isn't a clean solution except to run a smoothing filter over the sample.

# Load packages
library(terra)

# Create a sample raster  
r <- rast(nrow=10, ncol=10)
r[] <- 1:ncell(r)

# Create a line geometry
l <- st_linestring(matrix(c(-150, 150, -20, 20), ncol=2))
l <- vect(l)

# Extract raster values along line
extract <- terra::extract(r, l,xy=TRUE)
extract$sample_order <- 1:nrow(extract)

# Plot the results
plot(r)
plot(l,add=TRUE)
text(extract$x, extract$y, labels=extract$sample_order, cex=0.8,add=TRUE)

The sampling order of the raster doesn't follow the order that the line intersects the cells.

1
  • I found a solution that works for me: l2 <- terra::densify(l,interval =min(res(r))/2, flat=TRUE); p <- as.points(l2); extract2 <- terra::extract(r, p,xy=TRUE); The interval is set at half the resolution of the raster. It doesn't catch every single crossed pixel but will catch most. I found this to be a good compromise.
    – Adam C
    Commented Aug 10, 2023 at 19:22

1 Answer 1

1

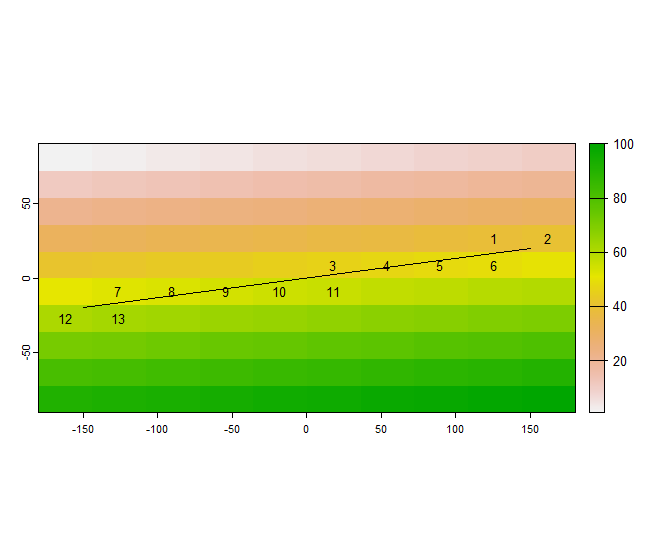
Another approach which saves having to densify, resulting in unnecessary duplicated samples which you might then want to thin out, may be to compute the distances of each sampled cell to the start of the line, and then re-order.

# I don't know how to get the x,y coords from a SpatVector, so convert to `sf`:
lsf = st_as_sf(l)
start = st_coordinates(lsf)[1,]

# working with `extract` as in the Q, add a distance column:
extract$d2 = (extract$x-start[1,1])^2 + (extract$y-start[1,2])^2

# copy with reordering by increasing distance    
e_order = extract[order(extract$d2),]

# add current ordering, and plot with ordering:
e_order$sample_order = 1:nrow(e_order)
plot(r)
plot(l, add=TRUE)
text(e_order$x, e_order$y, labels=e_order$sample_order, cex=0.8)

enter image description here

Note this only works for lines that are two points - for more complex linear features you need to split into simple two-point segments and loop, filtering out the duplicates you'd get where the end point of a segment is the start point of the next one.

Your Answer

By clicking “Post Your Answer”, you agree to our terms of service and acknowledge you have read our privacy policy.

Not the answer you're looking for? Browse other questions tagged or ask your own question.