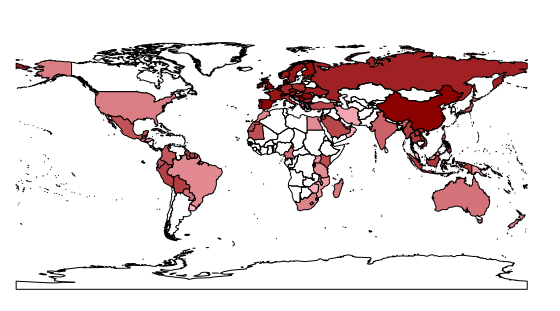
This seemed at first rather easy but turned out to be impossible to solve. I want to plot the wrld_simpl map but coloring the countries with a color gradient that depends on a variable. The countries with no values for the variable should not be filled but still show their borders.
Here is the dataframe with the variable averCL, used to color the polygons
d=read.csv(https://www.dropbox.com/scl/fi/kkvstxwjn6xrj3ezjok6t/example.csv?rlkey=cfq8sosg8ypa329l5yy1gbqyc&dl=0)
first I merge it with wrld_simpl
ws=merge(wrld_simpl, d, by = "NAME", all.x = TRUE)
Then, I create a color palette for the variation in averCL and give white color to the countries with no values of the variable
ws=merge(wrld_simpl, d, by = "NAME", all.x = TRUE)
ws$col=as.factor(ws$averCL)
levels(ws$col)=colorRampPalette(c("lightpink", "darkred"))(length(levels(ws$col)))
ws$col[is.na(ws$col)]<-"white"
Finally, I thought the countries should be plotted with that color gradient, but no...other colors appear (green..yellow..) instead. Why?
plot(ws, col = ws$col)


read.csvdoesn't work because a) no quote marks round the URL string and b) for me at least, that URL gets me to the dropbox index page where I have to click the "Download" button to get the data file. Try it withdl=1at the end.